Wall Street Greek

Editor's Picks | Energy | Market Outlook | Gold | Real Estate | Stocks | Politics
Wall Street, Greek

The Wall Street Greek blog is the sexy & syndicated financial securities markets publication of former Senior Equity Analyst Markos N. Kaminis. Our stock market blog reaches reputable publishers & private networks and is an unbiased, independent Wall Street research resource on the economy, stocks, gold & currency, energy & oil, real estate and more. Wall Street & Greece should be as honest, dependable and passionate as The Greek.


Wall Street, business & other videos updated regularly...

Seeking Alpha

Thursday, July 31, 2014

Stocks Today Reminiscent of a Recurring Bad Dream

historical chart of S&P 500 Index
Historical Chart of S&P 500 at Yahoo

Authored at Start of July

Ferguson
Shortly after the 4th of July holiday in 2007, the 5-year bull market that began in 2002 started to show real signs of weakness. In the face of vehement denials from the likes of Alan Greenspan, Ben Bernanke and even Jim Cramer, a few market analysts started to raise concerns over sub-prime loans and housing in general. Bond prices began falling rapidly in overnight trading, putting much pressure on what were historically low yield spreads. On a personal note, I remember Ken Fisher, et al mocking me when I suggested that the rash of mergers and acquisitions were about to come to an end as bond yields started rising and stocks started to crash.

Of course, the market weakened for a few months only to rise to an eventual all-time high in October 2007 before again heading cataclysmically downward to 2009 lows. Hard to believe that we’ve rebounded to even higher prices these past 5 years despite a faux economy propped up by mountains of debt. And yet bond prices of all maturities and grades remain near historic lows as the Fed continues to print money to prop up everything from bonds to stocks to commodities to real estate.

For some time, market commentators have suggested that the DOW (NYSE: DIA) would hit 17,000 before the market would reach an eventual top. Likewise, the S&P 500 (NYSE: SPY) is remarkably poised just under 2000, which could also present a round milestone for the very near future. But with the Shiller Cyclically-Adjusted P/E ratio at 26, current valuations are higher than at almost any point in history, most notably except 1929, 2000 and 2007. So it would seem the end to the bull-market may be fast approaching.

The question is: how long can this apparent Ponzi scheme possibly last?

Seems there is no end in sight, as the perpetually-fresh new money must go somewhere. And since it generally chases the highest returns, stocks could continue to rise. Maybe this time will somehow be different. More likely, it will not.

What will be the final grain of sand that topples the unstable mountain built upon nothing? What will provide the catalyst? Is there a geo-political crisis looming; a natural or manmade disaster? Is there any catastrophe that cannot be covered up by piles of money from Central Bankers across the world?

The recent, downward revision in Q1 GDP portends trouble. Look for misses and poor forward guidance as earnings reports begin to unfold. Energy stocks, which constitute a large sector of the S&P, may well lead the way down. July of 2014 looks as if it could provide a replay of 2007 with the market turning bearish by year end. Let us just hope it doesn’t begin with significant trouble in the bond market!

Article should interest investors in Bank of America (NYSE: BAC), J.P. Morgan Chase (NYSE: JPM), Goldman Sachs (NYSE: GS), Citigroup (NYSE: C), Morgan Stanley (NYSE: MS), Wells Fargo (NYSE: WFC), TD Bank (NYSE: TD), PNC Bank (NYSE: PNC), State Street (NYSE: STT), Janus (NYSE: JNS), T. Rowe Price (Nasdaq: TROW), General Electric (NYSE: GE), Wal-Mart (NYSE: WMT), McDonald's (NYSE: MCD), Alcoa (NYSE: AA), American Express (NYSE: AXP), Boeing (NYSE: BA), Caterpillar (NYSE: CAT), Cisco Systems (Nasdaq: CSCO), Chevron (NYSE: CVX), DuPont (NYSE: DD), Walt Disney (NYSE: DIS), Home Depot (NYSE: HD), Hewlett-Packard (NYSE: HPQ), IBM (NYSE: IBM), Intel (Nasdaq: INTC), Johnson & Johnson (NYSE: JNJ), Kraft (NYSE: KFT), Coca-Cola (NYSE: KO), 3M (NYSE: MMM), Merck (NYSE: MRK), Microsoft (Nasdaq: MSFT), Pfizer (NYSE: PFE), Procter & Gamble (NYSE: PG), AT&T (NYSE: T), Travelers (NYSE: TRV), United Technologies (NYSE: UTX), Verizon (NYSE: VZ), Exxon Mobil (NYSE: XOM), Paychex (Nasdaq: PAYX), Manpower (NYSE: MAN), Robert Half International (NYSE: RHI), 51Job Inc. (Nasdaq: JOBS), Monster World Wide (NYSE: MWW), Korn/Ferry International (NYSE: KFY), Administaff (NYSE: ASF), Kforce (Nasdaq: KFRC), TrueBlue (NYSE: TBI), Dice Holdings (NYSE: DHX), Kelly Services (Nasdaq: KELYA), SFN Group (NYSE: SFN), CDI Corp. (NYSE: CDI), Cross Country Healthcare (Nasdaq: CCRN), On Assignment (Nasdaq: ASGN), AMN Healthcare Services (NYSE: AHS), Barrett Business Services (Nasdaq: BBSI), Hudson Highland Group (Nasdaq: HHGP), StarTek (NYSE: SRT), RCM Technologies (Nasdaq: RCMT), VirtualScopics (Nasdaq: VSCP), General Employment Enterprises (NYSE: JOB) and TeamStaff (Nasdaq: TSTF).

Please see our disclosures at the Wall Street Greek website and author bio pages found there. This article and website in no way offers or represents financial or investment advice. Information is provided for entertainment purposes only.

seminal event

Labels: , , , ,

free email financial newsletter Bookmark and Share

Monday, September 16, 2013

Fall 2013 Stock Market Forecast

fall season
As the Fall Season approaches, U.S. Stock Indices are at an important juncture. Indeed, the S&P 500 seems poised to resume its own fall from August 2nd highs. Our fall 2013 stock market forecast follows.

Stock Market Forecast Fall 2013


stock market technical analyst
A student of the world economy and capital markets, Steven has applied dynamic system modeling principles to the burgeoning field of econometrics as well as to programmatic trading in equities and options. As an active trader, Steven has achieved a success rate of over 92% in positional equity trades.

Fall Just Around the Corner


From the chart below, we can observe a number of key technical points:

  • The highest probability Elliot Wave count defines the August 2nd high as a lasting top;
  • The first of many moves down began with Wave 1, which bottomed at 1627 on August 28th;
  • Based on its internal structure, Wave 2 up appears close to topping;
  • The S&P 500 cash index gapped down from 1685 on Aug 15th. That gap is now closed, as is the equivalent price gap in the DJIA;
  • Resistance lies between 1692-1700;
  • Daily Stochastics indicator (dashed green circle) shows that the S&P 500 is currently at an overbought level of more than 95%
  • The initial price target for Wave 3 down is 1610. By definition, Wave 3 down must be larger than Wave 1.

S&P 500 Index Elliot wave forecast 2013


In addition, there have been six confirmed observations of the “Hindenburg Omen” since early August. This indicator is an overall reflection of market health and reliably portends an imminent fall of 10% or more in index prices.

Furthermore, the economic and geopolitical backdrop is not at all supportive of fresh recovery highs in the three major stock indices:

  • Situation in Syria may have temporarily abated with a chemical weapons agreement, but even this may put short-term downward pressure on oil prices and the energy-rich S&P index
  • The FED will likely begin tapering bond purchases with the September FOMC announcement. Peaceful resolution of the Syrian dispute will further quiet any related move to postpone tapering
  • The fiscal debt ceiling looms large as the U.S. is poised to default on its debt by the end of October 2013
  • FED Chairman “Helicopter” Ben Bernanke will likely be replaced by a candidate with far less accommodative policies


In short, major indices are likely at or near the top of the retracement from the first major sell-off. While the S&P 500 index could rise as much as 1708 without penetrating the August 2nd high, it is more likely that September and October will bring a precipitous fall in both prices and outside air temperatures.

This article should be of interest to investors in the SPDR S&P 500 (NYSE: SPY), SPDR Dow Jones (NYSE: DIA), PowerShares QQQ (Nasdaq: QQQ), ProShares Ultra Short S&P 500 (NYSE: SDS), ProShares Short Dow 30 (NYSE: DOG) and the ProShares UltraShort QQQ (NYSE: QID).

DISCLOSURE: The author is currently short the S&P emini contract. He currently plans to cover his short position if prices rise above 1705. Please see our disclosures at the Wall Street Greek website and author bio pages found there. This article and website in no way offers or represents financial or investment advice. Information is provided for entertainment purposes only.

Labels: , , , ,

free email financial newsletter Bookmark and Share

Tuesday, January 22, 2013

Technical Analysis of the Stock Market

technical analysis
By Steven Ferguson:

Even as the S&P 500 Index has closed at a fresh new recovery high, we wanted to warn of dangerous underlying market conditions in this technical analysis of the stock market:

1. A confirmed Hindenburg Omen in mid-November points to a significant risk of market crash over the following 90 days. This indicator is extremely reliable. Note that the projected timing and magnitude of the ensuing "crash" are variables within that definition;

2. Technical non-confirmation of new index highs has remained in recent days. That is, the S&P 500 has made a new, intraday recovery high (although not a new closing high) while the Dow and NASDAQ remain below their previous high marks. This indicates classic price divergence and underlying market weakness, at least as long as the condition persists. If instead the Dow does make a new recovery high, that would bode well for a protracted rally, perhaps even into the second quarter. Should that occur, we would still remain vigilant and likely caution readers to "sell in May and walk away";

3. Market indices remain bound by a "Rising Bearish Wedge" pattern where the related trend-lines have provided very strong support and resistance. Index prices have already fallen out of the confines of that wedge but have recently retested the lower boundary. The only real question is how many more times will we trade up to that lower boundary before a more substantial drop occurs. This retesting could continue for some time, particularly if the Dow makes a new recovery high in the process;

4. The "official" Elliot Wave count supports a forecast of major downward movement in index prices;

5. Economic and political factors are pressing enough to provide catalyst for a big drop in the near future. See debt ceiling for more! A Fitch or Moody's (NYSE: MCO) ratings reduction in U.S. debt would almost certainly bring on a wave of selling in stocks. Ironically, this could lead to a flight from riskier assets back to bonds, the very instrument that's been downgraded. Makes us wonder about underlying motives!;

6. First quarter corporate earnings, projected growth and related P/E multiples don’t support much more upside in the near-term at least. Banks are particularly suspect as they trade at high multiples with more write-offs to follow (see Bank of America (NYSE: BAC) and Citigroup (NYSE: C) actions for examples). Good thing we keep relaxing reserve requirements and extending more liquidity …that's always provided adequate means to ensure the banking integrity, right?;

7. Seasonal fund rebalancing is in process though reallocation invariably takes place over a relatively long period to avoid impact on prices. Sell-side algorithms have become very sophisticated and can disguise this for weeks as 401K fund managers exit positions;

8. Bullish sentiment has once again peaked, providing a strong good contrarian indicator;

9. Volume remains very weak;

10. Based on demographics analyses (e.g. Harry Dent), consumer spending and investment patterns are about to change significantly and irreversibly. This observation alone is worth readers' attention, but has a much longer time horizon for lasting impact;

Readers should be mindful of the following technical levels to watch on the S&P cash index:


  • 1475 - Significant breakout above could extend rally into second quarter
  • 1440 - Significant breakout below would forebode more substantial decline


In any event, new long positions in stocks should be added only with extreme caution.

This technical analysis of the stock market is relevant to broader market interests, including investors in index relative securities including the SPDR S&P 500 (NYSE: SPY), SPDR Dow Jones Industrial Average (NYSE: DIA) and the PowerShares QQQ (NYSE: QQQ).

Disclosure: Ferguson is short the S&P e-minis

Please see our disclosures at the Wall Street Greek website and author bio pages found there. This article and website in no way offers or represents financial or investment advice. Information is provided for entertainment purposes only.

Labels: , , , , , , , , ,

free email financial newsletter Bookmark and Share

Monday, February 06, 2012

Apocalypse Now or Later?

technical stock strategistGreek Readers will note from our initial 2012 forecast:

"Any further upside rally in early 2012 should be contained in both price and duration. If prices fall below 1242 without reaching fresh highs, wave 3 down has already begun. Instead, a definitive break above resistance at 1292 would suggest an alternate wave count and could ultimately lead prices as high as 1350 before wave 3 down begins."

Prices for the S&P Index touched nearly 1345 intraday. The target for alternative Elliot Wave count is now nearly satisfied for an ending diagonal pattern. Prices should turn down from here.

Article should interest investors in SPDR Dow Jones Industrial Average (NYSE: DIA), SPDR S&P 500 (NYSE: SPY), PowerShares QQQ Trust (Nasdaq: QQQ), ProShares Short Dow 30 (NYSE: DOG), ProShares Ultra Short S&P 500 (NYSE: SDS), ProShares Ultra QQQ (NYSE: QLD), NYSE Euronext (NYSE: NYX), The NASDAQ OMX Group (Nasdaq: NDAQ), Intercontinental Exchange (NYSE: ICE), E*Trade Financial (Nasdaq: ETFC), Charles Schwab (Nasdaq: SCHW), Asset Acceptance Capital (Nasdaq: AACC), Affiliated Managers (NYSE: AMG), Ameriprise Financial (NYSE: AMP), TD Ameritrade (Nasdaq: AMTD), BGC Partners (Nasdaq: BGCP), Bank of New York Mellon (NYSE: BK), BlackRock (NYSE: BLK), CIT Group (NYSE: CIT), Calamos Asset Management (Nasdaq: CLMS), CME Group (NYSE: CME), Cohn & Steers (NYSE: CNS), Cowen Group (Nasdaq: COWN), Diamond Hill Investment (Nasdaq: DHIL), Dollar Financial (Nasdaq: DLLR), Duff & Phelps (Nasdaq: DUF), Encore Capital (Nasdaq: ECPG), Edelman Financial (Nasdaq: EF), Equifax (NYSE: EFX), Epoch (Nasdaq: EPHC), Evercore Partners (NYSE: EVR), EXCorp. (Nasdaq: EZPW), FBR Capital Markets (Nasdaq: FBCM), First Cash Financial (Nasdaq: FCFS), Federated Investors (NYSE: FII), First Marblehead (NYSE: FMD), Fidelity National Financial (NYSE: FNF), Financial Engines (Nasdaq: FNGN), FXCM (Nasdaq: FXCM), Gamco Investors (NYSE: GBL), GAIN Capital (Nasdaq: GCAP), Green Dot (Nasdaq: GDOT), GFI Group (Nasdaq: GFIG), Greenhill (NYSE: GHL), Gleacher (Nasdaq: GLCH), Goldman Sachs (NYSE: GS), Interactive Brokers (Nasdaq: IBKR), INTL FCStone (Nasdaq: INTL), Intersections (Nasdaq: INTX), Investment Technology (NYSE: ITG), Invesco (NYSE: IVZ), Jefferies (NYSE: JEF), JMP Group (NYSE: JMP), Janus Capital (NYSE: JNS), KBW (NYSE: KBW), Knight Capital (NYSE: KCG), Lazard (NYSE: LAZ), Legg Mason (NYSE: LM), LPL Investment (Nasdaq: LPLA), Ladenburg Thalmann (AMEX: LTS), Mastercard (NYSE: MA), Moody’s (NYSE: MCO), MF Global (NYSE: MF), Moneygram (NYSE: MGI), MarketAxess (Nasdaq: MKTX), Marlin Business Services (Nasdaq: MRLN), Morgan Stanley (NYSE: MS), MSCI (Nasdaq: MSCI), MGIC Investment (NYSE: MTG), NewStar Financial (Nasdaq: NEWS), National Financial Partners (NYSE: NFP), Nelnet (NYSE: NNI), Northern Trust (Nasdaq: NTRS), NetSpend (Nasdaq: NTSP), Ocwen Financial (NYSE: OCN), Oppenheimer (NYSE: OPY), optionsXpress (Nasdaq: OXPS), PICO (Nasdaq: PICO), Piper Jaffray (NYSE: PJC), PMI Group (NYSE: PMI), Penson Worldwide (Nasdaq: PNSN), Portfolio Recovery (Nasdaq: PRAA), Raymond James (NYSE: RJF), SEI Investments (Nasdaq: SEIC), Stifel Financial (NYSE: SF), Safeguard Scientifics (NYSE: SFE), State Street (NYSE: STT), SWS (NYSE: SWS), T. Rowe Price (Nasdaq: TROW), Visa (NYSE: V) and Virtus Investment Partners (Nasdaq: VRTS).

Please see our disclosures at the Wall Street Greek website and author bio pages found there. This article and website in no way offers or represents financial or investment advice. Information is provided for entertainment purposes only.

Phillip Phillips

Labels: , , , ,

free email financial newsletter Bookmark and Share

Thursday, January 12, 2012

Stock Apocalypse Now - Updated Technical View

stock chartistSince our 2012 technical forecast was issued earlier this year, S&P prices have closed right at key resistance of 1292. Apart from the further maturation of the current rally, not much else has changed.

Figure 1 below divides intermediate Elliot Waves into sub-waves in order to illustrate further the maturity of the current rally:

SP500 Index meeting resistance

  • Intermediate Wave 1 down, shown with black dotted line, consisted of five sub-waves (i) through (v), each of which is depicted with a red dotted line

  • Note that sub-wave (iii) down was the largest in magnitude

  • Countertrend rallies consist of three-wave movements, in this case shown
    as A through C, and depicted with blue dotted lines

  • Sub-wave C can be further subdivided into 5 smaller waves (not shown)


stock apocalypseIt would appear that the S&P is completing the fifth of five sub-waves within wave C of intermediate Wave 2. Note that daily stochastics are overbought at 94% and that S&P prices closed right at key resistance of 1292.

Once this move is complete, Intermediate Wave 3 down should begin. According to Elliot Wave theory, the magnitude of this wave will exceed that of Wave 1 down, which featured a 300 point drop.

I believe investors should consider taking trading profits from this recent rally to avoid the coming “stock-apocalypse.”

This article should interest investors in SPDR Dow Jones Industrial Average (NYSE: DIA), SPDR S&P 500 (NYSE: SPY), PowerShares QQQ Trust (Nasdaq: QQQ), PowerShares Short Dow 30 (NYSE: DOG), ProShares Ultra Short QQQ (NYSE: QLD), ProShares UltraShort S&P 500 (NYSE: SDS), iShares Russell 2000 (NYSE: IWM).

Please see our disclosures at the Wall Street Greek website and author bio pages found there. This article and website in no way offers or represents financial or investment advice. Information is provided for entertainment purposes only.

Wall Street Facebook

Labels: , , ,

free email financial newsletter Bookmark and Share

Wednesday, January 04, 2012

The Coming Stock Apocalypse

stock apocalypseDoomsday, Dec 21st 2012, may be almost a year away according to the Mayan calendar, but catastrophic downside for stock market indices is likely more imminent. Even in this Presidential election year, a return to March 2009 Bear Market lows is a definite possibility. Perhaps the only question is... when?

technical analyst

A Technical View


Against a backdrop of slowing growth and looming debt crises, both in the U.S. and abroad, stock valuations appear to be suspect:

  • Based on current forecasts, U.S. debt will likely eclipse GDP in 2012 even as economic growth slows in the United States. Monetary and fiscal policies are unlikely to be supportive in the current environment;

  • Bloomberg reports that over $200B in European debt will come due in the first quarter of 2012 and that the Euro Zone will likely enter recession;

  • Morgan Stanley has recently revised growth forecasts in emerging markets downward from 6.1% to 5.7%. Even that growth prediction is contingent upon supportive policy decisions from the U.S. and Europe.


Technical analysis also suggests that downside will resume early in 2012. Elliot Wave Theory identifies the current S&P 500 price pattern as the onset of intermediate Wave 3 down (see Figure 1 below). By definition, Wave 3 down includes the largest price move in a five-wave pattern. This would imply a downside target of roughly 950 or less for this wave movement alone.

stock apocalypse chart SP500 Index

From the chart in Figure 1, constructed at author's submission of article on January 1st, we can also observe the following:

  • Key resistance for the S&P is at the October high of 1292 with key support at the December 20th low of 1242;

  • The 50 day moving average remains below the 200 day moving average; note that this is the so-called “death-cross,” which some treat as the defining indicator for bear market conditions;

  • Index closing prices are still hovering near the benchmark 200-day moving average;

  • Daily Stochastics show that the S&P 500 is currently overbought as a result of the recent but muted “Santa Clause” rally;

  • Current price formation is that of a rising bearish wedge.


Any further upside rally in early 2012 should be contained in both price and duration. If prices fall below 1242 without reaching fresh highs, wave 3 down has already begun. Instead, a definitive break above resistance at 1292 would suggest an alternate wave count and could ultimately lead prices as high as 1350 before wave 3 down begins.

Should the rally continue, this final upward move may also foster conditions for a second, confirming “Hindenburg Omen.” The first instance of the indicator was observed on December 19th 2011. A second observation within a month would provide very reliable foreboding.

In any case, Greek readers should consider taking trading profits from this recent rally to avoid the coming "stock-apocalypse."

Disclosure: I have no position currently, however, I intend to sell (short) S&P futures at 1275.50 or higher.

Article should interest investors in SPDR Dow Jones Industrial Average (NYSE: DIA), SPDR S&P 500 (NYSE: SPY), PowerShares QQQ Trust (Nasdaq: QQQ), ProShares Short Dow 30 (NYSE: DOG), ProShares Ultra Short S&P 500 (NYSE: SDS), ProShares Ultra QQQ (NYSE: QLD), NYSE Euronext (NYSE: NYX), The NASDAQ OMX Group (Nasdaq: NDAQ), Intercontinental Exchange (NYSE: ICE), E*Trade Financial (Nasdaq: ETFC), Charles Schwab (Nasdaq: SCHW), Asset Acceptance Capital (Nasdaq: AACC), Affiliated Managers (NYSE: AMG), Ameriprise Financial (NYSE: AMP), TD Ameritrade (Nasdaq: AMTD), BGC Partners (Nasdaq: BGCP), Bank of New York Mellon (NYSE: BK), BlackRock (NYSE: BLK), CIT Group (NYSE: CIT), Calamos Asset Management (Nasdaq: CLMS), CME Group (NYSE: CME), Cohn & Steers (NYSE: CNS), Cowen Group (Nasdaq: COWN), Diamond Hill Investment (Nasdaq: DHIL), Dollar Financial (Nasdaq: DLLR), Duff & Phelps (Nasdaq: DUF), Encore Capital (Nasdaq: ECPG), Edelman Financial (Nasdaq: EF), Equifax (NYSE: EFX), Epoch (Nasdaq: EPHC), Evercore Partners (NYSE: EVR), EXCorp. (Nasdaq: EZPW), FBR Capital Markets (Nasdaq: FBCM), First Cash Financial (Nasdaq: FCFS), Federated Investors (NYSE: FII), First Marblehead (NYSE: FMD), Fidelity National Financial (NYSE: FNF), Financial Engines (Nasdaq: FNGN), FXCM (Nasdaq: FXCM), Gamco Investors (NYSE: GBL), GAIN Capital (Nasdaq: GCAP), Green Dot (Nasdaq: GDOT), GFI Group (Nasdaq: GFIG), Greenhill (NYSE: GHL), Gleacher (Nasdaq: GLCH), Goldman Sachs (NYSE: GS), Interactive Brokers (Nasdaq: IBKR), INTL FCStone (Nasdaq: INTL), Intersections (Nasdaq: INTX), Investment Technology (NYSE: ITG), Invesco (NYSE: IVZ), Jefferies (NYSE: JEF), JMP Group (NYSE: JMP), Janus Capital (NYSE: JNS), KBW (NYSE: KBW), Knight Capital (NYSE: KCG), Lazard (NYSE: LAZ), Legg Mason (NYSE: LM), LPL Investment (Nasdaq: LPLA), Ladenburg Thalmann (AMEX: LTS), Mastercard (NYSE: MA), Moody’s (NYSE: MCO), MF Global (NYSE: MF), Moneygram (NYSE: MGI), MarketAxess (Nasdaq: MKTX), Marlin Business Services (Nasdaq: MRLN), Morgan Stanley (NYSE: MS), MSCI (Nasdaq: MSCI), MGIC Investment (NYSE: MTG), NewStar Financial (Nasdaq: NEWS), National Financial Partners (NYSE: NFP), Nelnet (NYSE: NNI), Northern Trust (Nasdaq: NTRS), NetSpend (Nasdaq: NTSP), Ocwen Financial (NYSE: OCN), Oppenheimer (NYSE: OPY), optionsXpress (Nasdaq: OXPS), PICO (Nasdaq: PICO), Piper Jaffray (NYSE: PJC), PMI Group (NYSE: PMI), Penson Worldwide (Nasdaq: PNSN), Portfolio Recovery (Nasdaq: PRAA), Raymond James (NYSE: RJF), SEI Investments (Nasdaq: SEIC), Stifel Financial (NYSE: SF), Safeguard Scientifics (NYSE: SFE), State Street (NYSE: STT), SWS (NYSE: SWS), T. Rowe Price (Nasdaq: TROW), Visa (NYSE: V) and Virtus Investment Partners (Nasdaq: VRTS).

Please see our disclosures at the Wall Street Greek website and author bio pages found there. This article and website in no way offers or represents financial or investment advice. Information is provided for entertainment purposes only.

Greenwich Village private walking tours

Labels: , , , ,

free email financial newsletter Bookmark and Share

Tuesday, June 28, 2011

All Hell Breaking Loose?

technical analystSince our last technical analysis installment, the S&P has fallen below the April 18th low of $1294.70 and has remained below that level for nearly the entire month of June. As predicted, index prices have also since fallen 3% to a short term low around 1258 and presently sit just above another key support: the March 16th low of 1249 (see "A" in Figure 1). Should that level fail, indeed "all hell may break loose"!

All Hell Breaking Loose?


S&P 500 Index support resistance

The tension in the current price movements is accentuated by several converging lines of support and resistance:

  • Resistance: the April low of 1294;
  • Support: the March low of 1250;
  • Resistance: 20 day moving average at 1287;
  • Support 200 day moving average at 1264;
  • Resistance: the falling trend-line that has acted as resistance to any rally -- see grey dotted line labeled with “B” above


Of particular note is the current price relative to the 200 day moving average. A decisive drop below this level would likely prompt institutional selling.

In any case, index prices are definitely poised for a big move in either direction. With austerity measures in Greece hanging on a single-vote; with the possibility of pre-earnings announcements looming any day; and with seasonal weakness likely through the end of June, short-term capitulation to 1233-1240 would seem a precursor to any significant Fourth-of-July rally. Let the sparks fly!

forum message board chat

Article should interest investors in Bank of America (NYSE: BAC), J.P. Morgan Chase (NYSE: JPM), Goldman Sachs (NYSE: GS), Citigroup (NYSE: C), Morgan Stanley (NYSE: MS), Wells Fargo (NYSE: WFC), TD Bank (NYSE: TD), PNC Bank (NYSE: PNC), State Street (NYSE: STT), Janus (NYSE: JNS), T. Rowe Price (Nasdaq: TROW), General Electric (NYSE: GE), Wal-Mart (NYSE: WMT), McDonald's (NYSE: MCD), Alcoa (NYSE: AA), American Express (NYSE: AXP), Boeing (NYSE: BA), Caterpillar (NYSE: CAT), Cisco Systems (Nasdaq: CSCO), Chevron (NYSE: CVX), DuPont (NYSE: DD), Walt Disney (NYSE: DIS), Home Depot (NYSE: HD), Hewlett-Packard (NYSE: HPQ), IBM (NYSE: IBM), Intel (Nasdaq: INTC), Johnson & Johnson (NYSE: JNJ), Kraft (NYSE: KFT), Coca-Cola (NYSE: KO), 3M (NYSE: MMM), Merck (NYSE: MRK), Microsoft (Nasdaq: MSFT), Pfizer (NYSE: PFE), Procter & Gamble (NYSE: PG), AT&T (NYSE: T), Travelers (NYSE: TRV), United Technologies (NYSE: UTX), Verizon (NYSE: VZ), Exxon Mobil (NYSE: XOM), Paychex (Nasdaq: PAYX), Manpower (NYSE: MAN), Robert Half International (NYSE: RHI), 51Job Inc. (Nasdaq: JOBS), Monster World Wide (NYSE: MWW), Korn/Ferry International (NYSE: KFY), Administaff (NYSE: ASF), Kforce (Nasdaq: KFRC), TrueBlue (NYSE: TBI), Dice Holdings (NYSE: DHX), Kelly Services (Nasdaq: KELYA), SFN Group (NYSE: SFN), CDI Corp. (NYSE: CDI), Cross Country Healthcare (Nasdaq: CCRN), On Assignment (Nasdaq: ASGN), AMN Healthcare Services (NYSE: AHS), Barrett Business Services (Nasdaq: BBSI), Hudson Highland Group (Nasdaq: HHGP), StarTek (NYSE: SRT), RCM Technologies (Nasdaq: RCMT), VirtualScopics (Nasdaq: VSCP), General Employment Enterprises (NYSE: JOB) and TeamStaff (Nasdaq: TSTF).

Please see our disclosures at the Wall Street Greek website and author bio pages found there. This article and website in no way offers or represents financial or investment advice. Information is provided for entertainment purposes only.

wall street

Labels: , ,

free email financial newsletter Bookmark and Share

Monday, June 06, 2011

Smoke and Mirrors

smoke and mirrorsIn his latest report, Wall Street Greek Technical Analyst Steven Ferguson discusses the ongoing relevance of technical analysis, despite recent market defiance of technical metrics. Ferguson speaks of interference by an invisible hand at critical junctures, but suggests investors ignore smoke and mirrors and stay attuned to the trend-line.

Relative tickers: NYSE: DIA, NYSE: SPY, Nasdaq: QQQ, NYSE: DOG, NYSE: SDS, NYSE: QLD, NYSE: NYX, Nasdaq: NDAQ, NYSE: ICE, Nasdaq: ETFC, Nasdaq: SCHW, Nasdaq: AACC, NYSE: AMG, NYSE: AMP, Nasdaq: AMTD, Nasdaq: BGCP, NYSE: BK, NYSE: BLK, NYSE: CIT, Nasdaq: CLMS, NYSE: CME, NYSE: CNS, Nasdaq: COWN, Nasdaq: DHIL, Nasdaq: DLLR, Nasdaq: DUF, Nasdaq: ECPG, Nasdaq: EF, NYSE: EFX, Nasdaq: EPHC, NYSE: EVR, Nasdaq: EZPW, Nasdaq: FBCM, Nasdaq: FCFS, NYSE: FII, NYSE: FMD, NYSE: FNF, Nasdaq: FNGN, Nasdaq: FXCM, NYSE: GBL, Nasdaq: GCAP, Nasdaq: GDOT, Nasdaq: GFIG, NYSE: GHL, Nasdaq: GLCH, NYSE: GS, Nasdaq: IBKR, Nasdaq: INTL, Nasdaq: INTX, NYSE: ITG, NYSE: IVZ, NYSE: JEF, NYSE: JMP, NYSE: JNS, NYSE: KBW, NYSE: KCG, NYSE: LAZ, NYSE: LM, Nasdaq: LPLA, AMEX: LTS, NYSE: MA, NYSE: MCO, NYSE: MF, NYSE: MGI, Nasdaq: MKTX, Nasdaq: MRLN, NYSE: MS, Nasdaq: MSCI, NYSE: MTG, Nasdaq: NEWS, NYSE: NFP, NYSE: NNI, Nasdaq: NTRS, Nasdaq: NTSP, NYSE: OCN, NYSE: OPY, Nasdaq: OXPS, Nasdaq: PICO, NYSE: PJC, NYSE: PMI, Nasdaq: PNSN, Nasdaq: PRAA, NYSE: RJF, Nasdaq: SEIC, NYSE: SF, NYSE: SFE, NYSE: STT, NYSE: SWS, Nasdaq: TROW, NYSE: V and Nasdaq: VRTS.

Smoke and Mirrors


technical analystOnce again, market indices sit at a critical juncture. Since July 2010 and until last week, prices have traded within the trend channel similar to the one depicted in Figure 1 below. As annotated by the arrow labeled "A," the S&P closing price has recently dropped outside that channel, has since retested the lower boundary, and presently remains slightly below that level at $1300.61.

Furthermore, Friday’s close lies tenuously above the April 18th low of $1294.70 annotated by arrow "B" in the chart. A decisive break below $1294 would likely lead to a further correction of 3-5% in the near term and could very possibly signify that the often-anticipated top to the bear market rally occurred with the May peak and is already in place.

S&P 500 Index trend channel support

However, each time indices have reached such a level, it seems a not-so Invisible Hand has intervened to support asset prices and (ostensibly) prevent illiquidity. Often such intervention occurs during a Globex trading session, very often on a Sunday night when trading volume can be especially thin. Despite foreboding technical indicators, the market somehow defies gravity and resumes its multi-year rally against the backdrop of a carefully-orchestrated economic mirage.

Thus technical analysis, particularly analysis that has been founded on Elliot Wave, seems to be confounded by unnatural market forces, surreptitious intervention and even high frequency trading algorithms. This would seem to be a plausible outcome since the existence of wave patterns identified by Elliot Wave theory is predicated upon predominant action and reaction of human participants in the context of a free market.

However, EW’s Prechter and others insist (for example) that, because computers are programmed by humans based on their own understanding of market action, Elliot Wave patterns can still accurately capture and anticipate market price movements. And since the FED is like any other market respondent, it cannot hope to offset the eventual behavior of market masses through its policy decisions and monetary countermeasures. Nevertheless, EW practitioners have been forced to interpret rules in more obscure ways in order to accommodate these increasingly invasive and unnatural market forces.

So where does that leave technical analysis in general and Elliot Wave in particular? Should we abandon it? Should we ignore the signposts that it often provides?

The answer is a resounding "No!" Instead, we may confidently continue to use technical analysis as a basis for shorter-term trading and as a tool to optimize the timing of longer-term investment decisions.

In particular:

  • Technical analysis can be used to identify high probability outcomes in various time frames. The prediction of these outcomes does not eliminate the likelihood that lower probability outcomes will occur. The key is to identify the important price levels and respond appropriately when those levels are achieved or violated. In the present case, the author has a modest short position in June S&P futures with the expectation that prices could break key support of 1290. A decisive rise above 1306 would lead me to cover my short position.

  • Technical analysis seems more effective as a basis for short-term trading and for localized timing of longer-term investment decisions. A review of recent articles in this column would reveal that, although we may not have been able to identify the market top, each prediction has correctly warned of a significant price move. Furthermore, as we approach our third significant market top in a little over a decade, it would seem that such market timing is increasingly important. Particularly in the age of high-frequency trading promulgated largely by the investment banks, buy-and-hold may no longer provide a viable investment strategy. This increases the importance in awareness and interpretation of key technical indicators.

  • The principles that underlie Elliot Wave theory remain valid, particularly the emphasis on analytical understanding of crowd behavior. While identification of specific wave patterns can be problematic, Elliot Wave also emphasizes the measurement of market sentiment with the basic notion that extreme values foretell reversal. Such has been the case recently with precious metals, especially silver. With so many traders and retail investors scrambling to speculate on the price of silver, a significant drop was imminent. The recent drop in silver likely signifies just the beginning of the correction in the commodities bubble as a whole.

  • Economic fundamentals remain an important back drop to technical analysis. Through his own cogent evaluation of economic indicators, the Greek has often exposed the fallacy in popular views of economic growth. Even though the FED may continue to intervene with QE3, QE4 …QEx, and the US Government (indeed all governments worldwide) may continue to raise debt ceilings in their vain efforts to preserve public spending through taxpayer indebtedness, it is painfully obvious that these measures have largely failed to solve basic problems in housing, credit and unemployment.


Therefore, this is no time for complacency, even in long-term investments! The author urges readers to remain alert for signs of technical weakness. The Greek will continue to provide an important source of early warning for our readership.

forum message board chat

Article should interest investors in SPDR Dow Jones Industrial Average (NYSE: DIA), SPDR S&P 500 (NYSE: SPY), PowerShares QQQ Trust (Nasdaq: QQQ), ProShares Short Dow 30 (NYSE: DOG), ProShares Ultra Short S&P 500 (NYSE: SDS), ProShares Ultra QQQ (NYSE: QLD), NYSE Euronext (NYSE: NYX), The NASDAQ OMX Group (Nasdaq: NDAQ), Intercontinental Exchange (NYSE: ICE), E*Trade Financial (Nasdaq: ETFC), Charles Schwab (Nasdaq: SCHW), Asset Acceptance Capital (Nasdaq: AACC), Affiliated Managers (NYSE: AMG), Ameriprise Financial (NYSE: AMP), TD Ameritrade (Nasdaq: AMTD), BGC Partners (Nasdaq: BGCP), Bank of New York Mellon (NYSE: BK), BlackRock (NYSE: BLK), CIT Group (NYSE: CIT), Calamos Asset Management (Nasdaq: CLMS), CME Group (NYSE: CME), Cohn & Steers (NYSE: CNS), Cowen Group (Nasdaq: COWN), Diamond Hill Investment (Nasdaq: DHIL), Dollar Financial (Nasdaq: DLLR), Duff & Phelps (Nasdaq: DUF), Encore Capital (Nasdaq: ECPG), Edelman Financial (Nasdaq: EF), Equifax (NYSE: EFX), Epoch (Nasdaq: EPHC), Evercore Partners (NYSE: EVR), EXCorp. (Nasdaq: EZPW), FBR Capital Markets (Nasdaq: FBCM), First Cash Financial (Nasdaq: FCFS), Federated Investors (NYSE: FII), First Marblehead (NYSE: FMD), Fidelity National Financial (NYSE: FNF), Financial Engines (Nasdaq: FNGN), FXCM (Nasdaq: FXCM), Gamco Investors (NYSE: GBL), GAIN Capital (Nasdaq: GCAP), Green Dot (Nasdaq: GDOT), GFI Group (Nasdaq: GFIG), Greenhill (NYSE: GHL), Gleacher (Nasdaq: GLCH), Goldman Sachs (NYSE: GS), Interactive Brokers (Nasdaq: IBKR), INTL FCStone (Nasdaq: INTL), Intersections (Nasdaq: INTX), Investment Technology (NYSE: ITG), Invesco (NYSE: IVZ), Jefferies (NYSE: JEF), JMP Group (NYSE: JMP), Janus Capital (NYSE: JNS), KBW (NYSE: KBW), Knight Capital (NYSE: KCG), Lazard (NYSE: LAZ), Legg Mason (NYSE: LM), LPL Investment (Nasdaq: LPLA), Ladenburg Thalmann (AMEX: LTS), Mastercard (NYSE: MA), Moody’s (NYSE: MCO), MF Global (NYSE: MF), Moneygram (NYSE: MGI), MarketAxess (Nasdaq: MKTX), Marlin Business Services (Nasdaq: MRLN), Morgan Stanley (NYSE: MS), MSCI (Nasdaq: MSCI), MGIC Investment (NYSE: MTG), NewStar Financial (Nasdaq: NEWS), National Financial Partners (NYSE: NFP), Nelnet (NYSE: NNI), Northern Trust (Nasdaq: NTRS), NetSpend (Nasdaq: NTSP), Ocwen Financial (NYSE: OCN), Oppenheimer (NYSE: OPY), optionsXpress (Nasdaq: OXPS), PICO (Nasdaq: PICO), Piper Jaffray (NYSE: PJC), PMI Group (NYSE: PMI), Penson Worldwide (Nasdaq: PNSN), Portfolio Recovery (Nasdaq: PRAA), Raymond James (NYSE: RJF), SEI Investments (Nasdaq: SEIC), Stifel Financial (NYSE: SF), Safeguard Scientifics (NYSE: SFE), State Street (NYSE: STT), SWS (NYSE: SWS), T. Rowe Price (Nasdaq: TROW), Visa (NYSE: V) and Virtus Investment Partners (Nasdaq: VRTS).

Please see our disclosures at the Wall Street Greek website and author bio pages found there. This article and website in no way offers or represents financial or investment advice. Information is provided for entertainment purposes only.

Facebook business

Labels: , , ,

free email financial newsletter Bookmark and Share

Tuesday, January 18, 2011

Addicted Market Could Crash Off High

addicted market could crash off highs
Coming Down Off Liquidity High

Wall Street Greek Technical Strategist Steven Ferguson offers a fresh look at the perilous technical high wire act the market seems to be performing, and he warns again of serious trouble signs in the charts.


Relative Tickers: NYSE: GS, NYSE: C, NYSE: BAC, NYSE: WFC, NYSE: MS, NYSE: JPM, NYSE: TD, NYSE: PNC, Nasdaq: TROW, NYSE: STT, NYSE: STD, NYSE: DB, NYSE: BCS, NYSE: NBG, NYSE: JNS, NYSE: BX, NYSE: BLK, Nasdaq: ETFC, Nasdaq: TSCM, Nasdaq: AMTD, Nasdaq: MEMKX, Nasdaq: GECMX, Nasdaq: JEVOX, Nasdaq: PEMAX, NYSE: EEM, NYSE: VWO, Nasdaq: VEIEX, Nasdaq: ADRE, Nasdaq: PEBIX, Nasdaq: GMCEX, NYSE: MSF, NYSE: EEV, Nasdaq: REMGX, NYSE: GMM, NYSE: EDZ, AMEX: ETF, NYSE: FEO, NYSE: ESD, NYSE: MSD, NYSE: EMF, NYSE: TEI, Nasdaq: EMIF, NYSE: EFN, NYSE: EMT, NYSE: PCY, NYSE: PXH, NYSE: GMF, NYSE: GUR, NYSE: GML, NYSE: GMM, NYSE: EWX, NYSE: GAF, NYSE: EUF, NYSE: EET, Nasdaq: ABEMX, Nasdaq: AEMGX, Nasdaq: APERX, Nasdaq: PMGAX, Nasdaq: PMCIX, Nasdaq: AOTAX, Nasdaq: AOTCX, Nasdaq: AOTDX, Nasdaq: AEMPX, Nasdaq: AOTIX, Nasdaq: AEMEX, Nasdaq: AAMRX, Nasdaq: AEMFX, Nasdaq: AAEPX, Nasdaq: AEMMX, Nasdaq: ACKBX, Nasdaq: ACECX, Nasdaq: AMKIX, Nasdaq: TWMIX, Nasdaq: NDAQ, NYSE: PIZ, NYSE: PIE, NYSE: PDP, NYSE: DIA, NYSE: SPY, NYSE: NYX, NYSE: DOG, NYSE: SDS, NYSE: QLD, NYSE: IWM, NYSE: TWM, NYSE: IWD, NYSE: SDK, NYSE: ICE, Nasdaq: QQQQ, Nasdaq: HTOAX, Nasdaq: HTOTX, Nasdaq: HTOBX, Nasdaq: JTCIX, Nasdaq: JTCNX, Nasdaq: JTCAX.

Addicted Market Could Crash Off High


technical strategistFor a market propelled to new recovery highs by the same liquid(ity) drug that has fueled every major asset bubble in the past, and that has led to the current credit crisis hangover, the moment of truth has arrived. Either a correction will begin this week, or it will be postponed to another date several weeks or even months in the future, with the potential for drop only becoming more dramatic as that date with destiny is forestalled.
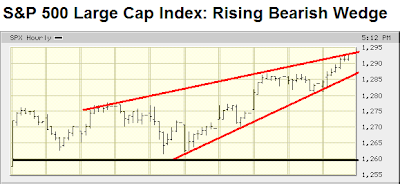
Either the S&P will fall below key support at 1260 or it will rise a minimum of 30 points higher. Should the S&P remain above 1291, I believe traders should cover open short positions.

Major indices closed Friday at the top of a trend-line that forms the upper boundary of a bearish rising wedge, depicted in the chart below. The rising wedge has formed within a larger trend channel. The more times that prices traverse between the lower and upper boundary of that channel, the weaker market internals have become. It is under these circumstances that we most often observe the Hindenburg Omen indicator.

S&P 500 large cap index rising bearish wedge

As well, the Elliot Wave structure, depicted in the chart below, now satisfies pattern identification rules for completion of the rally. Note that the entire rally is comprised of an A-B-C wave structure, where the index is presently completing wave C. Wave C is annotated in blue, with the five sub-waves each depicted individually. Importantly, the magnitude and duration of the move accomplished by the fifth wave in a five wave pattern now satisfies optimal criteria for pattern completion. And although Elliot Wave rules would have allowed the fifth wave to terminate at any time, such a pattern rarely truncates before the length of wave five equals that of wave one. Such is now the case, as can be seen through visual comparison of sub-waves 1 and 5 in the chart below.

S&P 500 Large Cap Index Elliot Wave Count

We also note that an important and reliable Phi Turn window has now passed. The clock is ticking on a confirmed Hindenburg Omen. Credit turmoil continues to churn even as the upchuck is swabbed down the financial drain. If markets continue to rise significantly above Friday's close, the next target is 2.5% higher again at the top of the trend channel. For a correction to begin in earnest, support levels must be penetrated. Greek readers must remain vigilant.

forum message board chat

Disclosure: I am short S&P 500 Index Futures

Article may interest investors in NYSE: GS, NYSE: C, NYSE: BAC, NYSE: WFC, NYSE: MS, NYSE: JPM, NYSE: TD, NYSE: PNC, Nasdaq: TROW, NYSE: STT, NYSE: STD, NYSE: DB, NYSE: BCS, NYSE: NBG, NYSE: JNS, NYSE: BX, NYSE: BLK, Nasdaq: MEMKX, Nasdaq: GECMX, Nasdaq: JEVOX, Nasdaq: PEMAX, NYSE: EEM, NYSE: VWO, Nasdaq: VEIEX, Nasdaq: ADRE, Nasdaq: PEBIX, Nasdaq: GMCEX, NYSE: MSF, NYSE: EEV, Nasdaq: REMGX, NYSE: GMM, NYSE: EDZ, AMEX: ETF, NYSE: FEO, NYSE: ESD, NYSE: MSD, NYSE: EMF, NYSE: TEI, Nasdaq: EMIF, NYSE: EFN, NYSE: EMT, NYSE: PCY, NYSE: PXH, NYSE: GMF, NYSE: GUR, NYSE: GML, NYSE: GMM, NYSE: EWX, NYSE: GAF, NYSE: EUF, NYSE: EET, Nasdaq: ABEMX, Nasdaq: AEMGX, Nasdaq: APERX, Nasdaq: PMGAX, Nasdaq: PMCIX, Nasdaq: AOTAX, Nasdaq: AOTCX, Nasdaq: AOTDX, Nasdaq: AEMPX, Nasdaq: AOTIX, Nasdaq: AEMEX, Nasdaq: AAMRX, Nasdaq: AEMFX, Nasdaq: AAEPX, Nasdaq: AEMMX, Nasdaq: ACKBX, Nasdaq: ACECX, Nasdaq: AMKIX, Nasdaq: TWMIX, Nasdaq: NDAQ, NYSE: PIZ, NYSE: PIE, NYSE: PDP, NYSE: DIA, NYSE: SPY, NYSE: NYX, NYSE: DOG, NYSE: SDS, NYSE: QLD, NYSE: IWM, NYSE: TWM, NYSE: IWD, NYSE: SDK, NYSE: ICE, Nasdaq: QQQQ, Nasdaq: HTOAX, Nasdaq: HTOTX, Nasdaq: HTOBX, Nasdaq: JTCIX, Nasdaq: JTCNX, Nasdaq: JTCAX.

Please see our disclosures at the Wall Street Greek website and author bio pages found there. This article and website in no way offers or represents financial or investment advice. Information is provided for entertainment purposes only.

economic reports

Labels: , , , ,

free email financial newsletter Bookmark and Share

Tuesday, January 11, 2011

Imminent Stock Market Decline

imminent stock market decline
The Long and Short of It

In his last article, Wall Street Greek Technical Analyst Steven Ferguson outlined several ominous technical indicators that point to a change in market direction. In this piece, he clarifies and further details how the turn might play out given various factors at play. Ferguson says a "rounded top" is more likely in the near-term, which supports the exit from long positions at this point, while not necessarily directing immediate aggressive shorting.


Relative Tickers: NYSE: GS, NYSE: C, NYSE: BAC, NYSE: WFC, NYSE: MS, NYSE: JPM, NYSE: TD, NYSE: PNC, Nasdaq: TROW, NYSE: STT, NYSE: STD, NYSE: DB, NYSE: BCS, NYSE: NBG, NYSE: JNS, NYSE: BX, NYSE: BLK, Nasdaq: ETFC, Nasdaq: TSCM, Nasdaq: AMTD, Nasdaq: MEMKX, Nasdaq: GECMX, Nasdaq: JEVOX, Nasdaq: PEMAX, NYSE: EEM, NYSE: VWO, Nasdaq: VEIEX, Nasdaq: ADRE, Nasdaq: PEBIX, Nasdaq: GMCEX, NYSE: MSF, NYSE: EEV, Nasdaq: REMGX, NYSE: GMM, NYSE: EDZ, AMEX: ETF, NYSE: FEO, NYSE: ESD, NYSE: MSD, NYSE: EMF, NYSE: TEI, Nasdaq: EMIF, NYSE: EFN, NYSE: EMT, NYSE: PCY, NYSE: PXH, NYSE: GMF, NYSE: GUR, NYSE: GML, NYSE: GMM, NYSE: EWX, NYSE: GAF, NYSE: EUF, NYSE: EET, Nasdaq: ABEMX, Nasdaq: AEMGX, Nasdaq: APERX, Nasdaq: PMGAX, Nasdaq: PMCIX, Nasdaq: AOTAX, Nasdaq: AOTCX, Nasdaq: AOTDX, Nasdaq: AEMPX, Nasdaq: AOTIX, Nasdaq: AEMEX, Nasdaq: AAMRX, Nasdaq: AEMFX, Nasdaq: AAEPX, Nasdaq: AEMMX, Nasdaq: ACKBX, Nasdaq: ACECX, Nasdaq: AMKIX, Nasdaq: TWMIX, Nasdaq: NDAQ, NYSE: PIZ, NYSE: PIE, NYSE: PDP, NYSE: DIA, NYSE: SPY, NYSE: NYX, NYSE: DOG, NYSE: SDS, NYSE: QLD, NYSE: IWM, NYSE: TWM, NYSE: IWD, NYSE: SDK, NYSE: ICE, Nasdaq: QQQQ, Nasdaq: HTOAX, Nasdaq: HTOTX, Nasdaq: HTOBX, Nasdaq: JTCIX, Nasdaq: JTCNX, Nasdaq: JTCAX.

Imminent Stock Market Decline: The Long and Short of It


econometricsAt present, it would appear that the market turning point is indeed at hand. The Greek exposited the real unemployment situation in his recap of Friday's labor report, which as usual, was meant to obscure the truth. Here in the Midwest, most of those I know on unemployment rolls have given up looking for work and would prefer to continue receiving their perpetual entitlement. And those who could offer them employment are uncertain about capital expenditures in the future, so they continue to do more with less while they still have more to do.

Do these signs of an enervated economy mean a stock market crash (or worse, a bond market crash!) is imminent? Did any of the technical indicators reviewed in "Who You Callin Short?" suggest a 20% decline should occur over the next five trading sessions? Certainly not. And just in case there might be any confusion as to the nature of the prediction offered by the previous article, here are some key clarifications:

  • None of the cited technical indicators suggested that there would be any dramatic sell-off occurring on or about January 6, 2011. Instead, the Phi Turn date predicts a turning point in market action, probably containing an intraday high that would last for many weeks if not months/years (depending on whether the Phi Turn event marks THE top). The Phi Turn date has a tolerance of a few days in either direction. The presence of two Phi Turns within the past 6 trading session suggests that the turn may have occurred on Thursday.

  • However, given the strong uptrend that has led to this point, the actual reversal is more likely to form a "rounded top" than a sharp ski slope. There remains a possibility within the Elliot Wave count (five of five) that the DOW could reach back to the 11750-11775 range, corresponding to 1280-1291 on the S&P. This would allow for one more intraday high early this week without violating the rules of the wave pattern. After that, a return to higher volatility is to be expected as the VIX appears ready to break out.

  • Still, we note that the S&P cash index dropped ten points intraday on Friday to a very important line of technical support, 1260. A break below this support early this week would solidify the case for the market reversal. A convincing break back above 1291 would signal several more weeks of uptrend, with the projected price 2.5% above the previous 52-week high.

  • Last, the confirmed Hindenburg Omen does forebode a steep decline but not necessarily an imminent one. In the last 25 years, Dr. Robert McHugh of Main Line Investors, Inc. found that 28 "officially" confirmed Hindenburg Omen signals have occurred. In all but one of those cases, a decline of at least 5% followed. In almost a third of those cases, a crash of 15-20% or more occurred. The precipitous decline could start at any time and could last any number of trading sessions.

Based on the above, this author recommends that readers take profits from long positions. More aggressive traders may weigh short positions in index ETFs, sectors or individual stocks that are highly correlated with the market at large. That's the long and the short of it.

Disclosure: I am short S&P 500 Index Futures

11:11 1/11/11 forum message board chat

Article may interest investors in NYSE: GS, NYSE: C, NYSE: BAC, NYSE: WFC, NYSE: MS, NYSE: JPM, NYSE: TD, NYSE: PNC, Nasdaq: TROW, NYSE: STT, NYSE: STD, NYSE: DB, NYSE: BCS, NYSE: NBG, NYSE: JNS, NYSE: BX, NYSE: BLK, Nasdaq: MEMKX, Nasdaq: GECMX, Nasdaq: JEVOX, Nasdaq: PEMAX, NYSE: EEM, NYSE: VWO, Nasdaq: VEIEX, Nasdaq: ADRE, Nasdaq: PEBIX, Nasdaq: GMCEX, NYSE: MSF, NYSE: EEV, Nasdaq: REMGX, NYSE: GMM, NYSE: EDZ, AMEX: ETF, NYSE: FEO, NYSE: ESD, NYSE: MSD, NYSE: EMF, NYSE: TEI, Nasdaq: EMIF, NYSE: EFN, NYSE: EMT, NYSE: PCY, NYSE: PXH, NYSE: GMF, NYSE: GUR, NYSE: GML, NYSE: GMM, NYSE: EWX, NYSE: GAF, NYSE: EUF, NYSE: EET, Nasdaq: ABEMX, Nasdaq: AEMGX, Nasdaq: APERX, Nasdaq: PMGAX, Nasdaq: PMCIX, Nasdaq: AOTAX, Nasdaq: AOTCX, Nasdaq: AOTDX, Nasdaq: AEMPX, Nasdaq: AOTIX, Nasdaq: AEMEX, Nasdaq: AAMRX, Nasdaq: AEMFX, Nasdaq: AAEPX, Nasdaq: AEMMX, Nasdaq: ACKBX, Nasdaq: ACECX, Nasdaq: AMKIX, Nasdaq: TWMIX, Nasdaq: NDAQ, NYSE: PIZ, NYSE: PIE, NYSE: PDP, NYSE: DIA, NYSE: SPY, NYSE: NYX, NYSE: DOG, NYSE: SDS, NYSE: QLD, NYSE: IWM, NYSE: TWM, NYSE: IWD, NYSE: SDK, NYSE: ICE, Nasdaq: QQQQ, Nasdaq: HTOAX, Nasdaq: HTOTX, Nasdaq: HTOBX, Nasdaq: JTCIX, Nasdaq: JTCNX, Nasdaq: JTCAX.

Please see our disclosures at the Wall Street Greek website and author bio pages found there. This article and website in no way offers or represents financial or investment advice. Information is provided for entertainment purposes only.

best hotels in New York City

Labels: , , , ,

free email financial newsletter Bookmark and Share

Wednesday, January 05, 2011

Short the S&P 500 Index in Early 2011

short the S&P 500 Index in early 2011 stock market
Who You Callin Short?

This Wall Street Greek author is now short the market, specifically the S&P 500. In my view, we have reached the tipping point in a rally that has lasted almost two years on borrowed money and borrowed time. Time is growing short and I am afraid smart money is about to do the same.


Relative Tickers: NYSE: GS, NYSE: C, NYSE: BAC, NYSE: WFC, NYSE: MS, NYSE: JPM, NYSE: TD, NYSE: PNC, Nasdaq: TROW, NYSE: STT, NYSE: STD, NYSE: DB, NYSE: BCS, NYSE: NBG, Nasdaq: MEMKX, Nasdaq: GECMX, Nasdaq: JEVOX, Nasdaq: PEMAX, NYSE: EEM, NYSE: VWO, Nasdaq: VEIEX, Nasdaq: ADRE, Nasdaq: PEBIX, Nasdaq: GMCEX, NYSE: MSF, NYSE: EEV, Nasdaq: REMGX, NYSE: GMM, NYSE: EDZ, AMEX: ETF, NYSE: FEO, NYSE: ESD, NYSE: MSD, NYSE: EMF, NYSE: TEI, Nasdaq: EMIF, NYSE: EFN, NYSE: EMT, NYSE: PCY, NYSE: PXH, NYSE: GMF, NYSE: GUR, NYSE: GML, NYSE: GMM, NYSE: EWX, NYSE: GAF, NYSE: EUF, NYSE: EET, Nasdaq: ABEMX, Nasdaq: AEMGX, Nasdaq: APERX, Nasdaq: PMGAX, Nasdaq: PMCIX, Nasdaq: AOTAX, Nasdaq: AOTCX, Nasdaq: AOTDX, Nasdaq: AEMPX, Nasdaq: AOTIX, Nasdaq: AEMEX, Nasdaq: AAMRX, Nasdaq: AEMFX, Nasdaq: AAEPX, Nasdaq: AEMMX, Nasdaq: ACKBX, Nasdaq: ACECX, Nasdaq: AMKIX, Nasdaq: TWMIX, Nasdaq: NDAQ, NYSE: PIZ, NYSE: PIE, NYSE: PDP, NYSE: DIA, NYSE: SPY, NYSE: NYX, NYSE: DOG, NYSE: SDS, NYSE: QLD, NYSE: IWM, NYSE: TWM, NYSE: IWD, NYSE: SDK, NYSE: ICE, Nasdaq: QQQQ, Nasdaq: HTOAX, Nasdaq: HTOTX, Nasdaq: HTOBX, Nasdaq: JTCIX, Nasdaq: JTCNX, Nasdaq: JTCAX.

Short the S&P 500 Index and the Market in Early 2011


technical analystIn previous articles, I have recommended that readers take cash out of any long positions at key junctures. In each of these articles, I have presented a case that the technical formation in the market at that particular point in time represented the top of the bear market rally. As is always true with such technical indicators, even with the market in general, any bearish or bullish outlook always comes with associated statistical probabilities. So it is up to the reader to judge in accord with a recent WSG article whether I was "wrong or early?"

In this particular case, many technical indicators suggest that odds are high a decline is about to occur and that the current formation represents the top of the bear market rally:


  • According to Elliot Wave (EW) theory, the current five wave structure, which is in turn a sub-structure of the final leg in the rally that began in March 2009, logically completes the retracement of bull market highs from 2007. Of course, the uncertainty with application of Elliot Wave is that many such structures are possible within the fractal wave patterns defined by EW rules. Since these patterns are completely recognizable only in retrospect, rules offer contingency outcomes if and when those rules are broken.

  • This same five wave structure forms a classic "bearish rising wedge" on the S&P. A break below 1255 on the S&P Cash Index would suggest that prices are beginning to deteriorate, with a short-term technical target at around 1180.

  • Any previous technical target associated with the bullish (inverse) head and shoulders which formed with the market bottom has been fully achieved.

  • Index retracement is above the key Fibonacci level of 61.8% and is now at around two-thirds or 66.7% of the drop from bull market highs. Some view this level as technically important though it does not correspond to a Fibonacci ratio.

  • Two key Phi Turn dates occur within a one week trading window: Dec 29th 2010 and Jan 6th 2011. Phi Turn dates are calculated using Fibonacci ratios applied to the time period between key market reversals. The calculated dates have proven very meaningful, often identifying market bottoms and tops to the day.

  • Cyclic indicators, particularly the weekly stochastics indicator shows the market is overbought and topping.

  • We now have a confirmed Hindenburg Omen, which suggests a very high probability of market decline. The first omen was observed on August 20th, 2010, with unofficial confirmation on Dec 14th and official confirmation on Dec 15th. The probability that a stock market crash occurs is higher than normal, and the probability of a severe decline is quite high. This Omen has appeared before all of the stock market crashes, or panic events, of the past 25 years - all of them. No panic selloff (greater than 15 percent) occurred over the past 25 years without the presence of a Hindenburg Omen.

  • Most of this rally, particularly in the waning stages, has occurred on very light and decreasing volume, very likely supported by POMO operations. This leaves the market susceptible to flash crash conditions at any time.

model based controls designAs The Greek often points out, technical indicators should not be viewed outside of the context of underlying economic conditions, particularly when attempting to use these indicators to identify a reversal. In my estimation and based on my experience as a small business owner, the economic recovery is farcical and is not supportive of the capital investment necessary to restore real growth.

Despite suspect reports, unemployment remains up while banks are reluctant to invest in low yield US businesses. Instead, they continue to chase emerging markets with balance sheets repaired by taxpayer money, and in the process, are creating even more dangerous bubbles abroad. In my travels during 2010, I have found that even those people who are benefiting from the investments see the growth as unsustainable.

More importantly, we remain in the midst of a bond market bubble that dwarfs any other problem on the economic landscape. Any temptation to declare "mission accomplished" with the recovery would only increase headwinds in the form of inflation and higher interest rates. Any drop in the highly suspect dollar accomplishes the same. For this reason, I remain convinced that the Federal Reserve will be forced to keep interest rates low, not through QE3 and QE4, but through the deflation of higher risk assets. This will keep investors in the bond market for the foreseeable future, ensuring that bank balance sheets are protected from further, more devastating loss.

Disclosure:I am short S&P 500 Index Futures

short stock market forum message board chat

Article may interest investors in NYSE: GS, NYSE: C, NYSE: BAC, NYSE: WFC, NYSE: MS, NYSE: JPM, NYSE: TD, NYSE: PNC, Nasdaq: TROW, NYSE: STT, NYSE: STD, NYSE: DB, NYSE: BCS, NYSE: NBG, Nasdaq: MEMKX, Nasdaq: GECMX, Nasdaq: JEVOX, Nasdaq: PEMAX, NYSE: EEM, NYSE: VWO, Nasdaq: VEIEX, Nasdaq: ADRE, Nasdaq: PEBIX, Nasdaq: GMCEX, NYSE: MSF, NYSE: EEV, Nasdaq: REMGX, NYSE: GMM, NYSE: EDZ, AMEX: ETF, NYSE: FEO, NYSE: ESD, NYSE: MSD, NYSE: EMF, NYSE: TEI, Nasdaq: EMIF, NYSE: EFN, NYSE: EMT, NYSE: PCY, NYSE: PXH, NYSE: GMF, NYSE: GUR, NYSE: GML, NYSE: GMM, NYSE: EWX, NYSE: GAF, NYSE: EUF, NYSE: EET, Nasdaq: ABEMX, Nasdaq: AEMGX, Nasdaq: APERX, Nasdaq: PMGAX, Nasdaq: PMCIX, Nasdaq: AOTAX, Nasdaq: AOTCX, Nasdaq: AOTDX, Nasdaq: AEMPX, Nasdaq: AOTIX, Nasdaq: AEMEX, Nasdaq: AAMRX, Nasdaq: AEMFX, Nasdaq: AAEPX, Nasdaq: AEMMX, Nasdaq: ACKBX, Nasdaq: ACECX, Nasdaq: AMKIX, Nasdaq: TWMIX, Nasdaq: NDAQ, NYSE: PIZ, NYSE: PIE, NYSE: PDP, NYSE: DIA, NYSE: SPY, NYSE: NYX, NYSE: DOG, NYSE: SDS, NYSE: QLD, NYSE: IWM, NYSE: TWM, NYSE: IWD, NYSE: SDK, NYSE: ICE, Nasdaq: QQQQ, Nasdaq: HTOAX, Nasdaq: HTOTX, Nasdaq: HTOBX, Nasdaq: JTCIX, Nasdaq: JTCNX, Nasdaq: JTCAX.

Please see our disclosures at the Wall Street Greek website and author bio pages found there. This article and website in no way offers or represents financial or investment advice. Information is provided for entertainment purposes only.

pizza 10028 New York

Labels: , , ,

free email financial newsletter Bookmark and Share

Wednesday, May 19, 2010

Technical Indicators Revisited

technical indicators analysisWall Street Greek technical analyst Steven Ferguson offers his latest technical analysis and market outlook below. Mr. Ferguson suggests the end of the bear market rally may be at hand, and if the conditions he lays out fall into place, a fall to the 900 mark on the S&P 500 Index is a real possibility. It is important to note that Mr. Ferguson produced this latest review of technical indicators for us this past Sunday, and updated the data before the market opened on May 18. The major indices have since completed their short-term rally and touched their respective 200 day moving averages as forecast.

(Tickers: NYSE: EDZ, NYSE: DIA, NYSE: SPY, Nasdaq: QQQQ, NYSE: DOG, NYSE: SDS, NYSE: QLD, NYSE: NYX, NYSE: ICE, Nasdaq: NDAQ)

Technical Indicators


technical indicators analystOn Labor Day of last year, the Greek published my article highlighting a technical charting pattern that had appeared in most major stock indices at that time: a bullish (inverse) Head & Shoulders. I was admittedly skeptical that the current bear market rally would take prices high enough to complete the pattern, particularly within the time frame demanded by a strict interpretation of related criteria for the price target. Turns out that, while I may have been correct about the timing I was ultimately wrong about the eventual level.

On April 26th of 2010, the S&P 500 (cash index) hit a high price of 1219.80, approximately 30 points shy of the nominal 1250 target highlighted in our previous article (see Figure 1 below). Note that a slightly more precise calculation of that target would have produced a refined value of 1220, which would make the intraday high remarkably close to the projection.

technical indicators inverse head and shoulders patter sp500 index

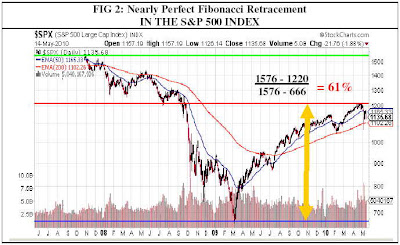
As well, another important technical condition may have also been satisfied on April 26th with the near completion of a textbook 61.8% Fibonacci Retracement. Both the DOW Industrials as well as the S&P 500 completed such a near-perfect retracement on that date (see Figure 2 below), recovering approximately 61% of the value lost between the October 2007 high and March 2009 bear market low. Readers may recall the significance of Fibonacci numbers in (human) behavioral processes from a previous installment of our series on technical analysis.

technical indicators perfect fibonacci retracement

So does the culmination of these two important technical events suggest that the bear market rally is over? At the risk of being labeled as a Perma-Bear Analyst who thrice cried "Wolf," I dare say this may be the case. But let us continue to examine the facts.

During the recent Fat-fingered Flash Crash, major indices not only broke through their 50 day exponential moving averages (EMA), but also dropped briefly below the more important 200 day mark. Moreover, indices have failed to break back above what now appears to be 50EMA resistance and seem bound to retest the longer-term 200 day average in the near future. This "bears" watching closely!

technical indicators basic resistance support sp 500

Looking also at the averages on a weekly time frame, we again see some important conditions afoot. Note that the major indices fell below their 13-week EMA for only the second time since the onset of bull market conditions. As long as indices remain bounded by the 34-week EMA support, the rally may indeed continue longer.

technical indicators longer term s&p 500 index

However, if the 13 week EMA were to cross back below the 34 week EMA, Bear Market conditions would again prevail, this time with a much lower likelihood of intervention by governments and central banks the world over. It is worth pointing out that these weekly indicators have provided a reasonably accurate segregation of market conditions for many instances in the past, notably marking the onset of the Bear Market in late 2007 as well as the return to low-volatility, Bullish conditions in July of 2010.

Last, Elliot Wave Theory once again points to a strong possibility that Wave B, the rally-phase of the Bear Market, completed on April 26th. The current wave structure suggests that the first minor wave of Wave C down began with the Flash Crash as sub-wave 1, continued with a brief 50 point respite rally at the onset of sub-wave 2, and will continue with sub-wave 3 set to begin early next week. A convincing break above 1160 on the S&P index would suggest the prevailing bearish wave count might be incorrect, and that we might hit one more recovery high before summer's end. A close below the 200 day EMA would reinforce the reality that we are instead heading back to the 900 level over the next few months.

How should Greek readers respond in these "emerging" conditions? Once again, I believe it is prudent to raise cash. Given the underlying, farcical macro-economic conditions and ever-more-tenuous political landscape across the globe, with headwinds from alarming debt, inevitable taxation, imminently higher interest rates, recalcitrant joblessness, dwindling stimulus, …even fallout from both natural and manmade disasters, … readers may choose to take a more aggressive approach. To that end, I might be inclined to join Jim Rogers in his recent short position in emerging markets. In particular, readers may be interested in looking at (NYSEArca: EDZ), an ultra-bear emerging market ETF as a means to hedge the current downside risk.

technical indicators forum message board chat rooms

Article may interest investors in Nasdaq: MEMKX, Nasdaq: GECMX, Nasdaq: JEVOX, Nasdaq: PEMAX, NYSE: EEM, NYSE: VWO, Nasdaq: VEIEX, Nasdaq: ADRE, Nasdaq: PEBIX, Nasdaq: GMCEX, NYSE: MSF, NYSE: EEV, Nasdaq: REMGX, NYSE: GMM, NYSE: EDZ, AMEX: ETF, NYSE: FEO, NYSE: ESD, NYSE: MSD, NYSE: EMF, NYSE: TEI, Nasdaq: EMIF, NYSE: EFN, NYSE: EMT, NYSE: PCY, NYSE: PXH, NYSE: GMF, NYSE: GUR, NYSE: GML, NYSE: GMM, NYSE: EWX, NYSE: GAF, NYSE: EUF, NYSE: EET, Nasdaq: ABEMX, Nasdaq: AEMGX, Nasdaq: APERX, Nasdaq: PMGAX, Nasdaq: PMCIX, Nasdaq: AOTAX, Nasdaq: AOTCX, Nasdaq: AOTDX, Nasdaq: AEMPX, Nasdaq: AOTIX, Nasdaq: AEMEX, Nasdaq: AAMRX, Nasdaq: AEMFX, Nasdaq: AAEPX, Nasdaq: AEMMX, Nasdaq: ACKBX, Nasdaq: ACECX, Nasdaq: AMKIX, Nasdaq: TWMIX, Nasdaq: NDAQ, NYSE: PIZ, NYSE: PIE, NYSE: PDP, NYSE: DIA, NYSE: SPY, NYSE: NYX, NYSE: DOG, NYSE: SDS, NYSE: QLD, NYSE: IWM, NYSE: TWM, NYSE: IWD, NYSE: SDK, NYSE: ICE, Nasdaq: QQQQ, Nasdaq: HTOAX, Nasdaq: HTOTX, Nasdaq: HTOBX, Nasdaq: JTCIX, Nasdaq: JTCNX, Nasdaq: JTCAX.

Please see our disclosures at the Wall Street Greek website and author bio pages found there. This article and website in no way offers or represents financial or investment advice. Information is provided for entertainment purposes only.

technical indicators

Labels: ,

free email financial newsletter Bookmark and Share

Wednesday, December 02, 2009

Phi-Turn Analysis Exposes Turn Date

Phi-Turn Analysis Turn Date

To Every Season Turn, Turn...

Visit the front page of Wall Street Greek to see our current coverage of Wall Street, economic reports and global financial markets.

(Tickers: NYSE: PIZ, PIE, PDP, DIA, SPY, NYX, DOG, SDS, QLD, IWM, TWM, IWD, SDK, ICE, Nasdaq: QQQQ, HTOAX, HTOTX, HTOBX, JTCIX, JTCNX, JTCAX, DIA, SPY, QQQQ, NYX, DOG, SDS, QLD)

Phi-Turn analysis technical Phi Turn DateTo Every Season, Turn, Turn Turn! The Byrds, and before them Solomon, warned that all seasons come to an end. While the short-term forecast continues to allow for a rise into market highs through the close today, it is likely that the bear market rally will yield to a change in season. December 2nd marks a potentially significant turning point as defined by a so-called "Phi-Turn Date."

Phi-Turn Analysis Exposes Turn Date


Phi-Turn Analysis is just one method of identifying market inflection points. These methods range from examination of lunar cycles, to other astrological events and onto more believable analysis of cyclic content in the market indices. Phi Turn Analysis was conceived by Dr. Robert McHugh, and relies on Fibonacci ratios to establish market turning points. The basis for the calculation begins with the significant top established in 2000.

Throughout 2008, the calculated Phi Turn dates have fallen quite remarkably on significant tops and bottoms in the market. While not every date marks the onset of a multi-month reversal, almost no reversal has happened on a day that has not matched the Phi Turn calculation result.

NOTE: This article is an amendment to the most recent "S&P 500 Index Winter Forecast." Through the description of Phi Turn Analysis, this completes the series on the search for bear market rally top. We realized Turn Analysis had not been addressed in the article series.

forum message board chat rooms stocks business
Article may interest investors in NYSE: PIZ, NYSE: PIE, NYSE: PDP, NYSE: DIA, NYSE: SPY, NYSE: NYX, NYSE: DOG, NYSE: SDS, NYSE: QLD, NYSE: IWM, NYSE: TWM, NYSE: IWD, NYSE: SDK, NYSE: ICE, Nasdaq: QQQQ, Nasdaq: HTOAX, Nasdaq: HTOTX, Nasdaq: HTOBX, Nasdaq: JTCIX, Nasdaq: JTCNX, Nasdaq: JTCAX. Please see our disclosures at the Wall Street Greek website and author bio pages found there. This article and website in no way offers or represents financial or investment advice. Information is provided for entertainment purposes only.

Labels: ,

free email financial newsletter Bookmark and Share