Wall Street Greek

Editor's Picks | Energy | Market Outlook | Gold | Real Estate | Stocks | Politics
Wall Street, Greek

The Wall Street Greek blog is the sexy & syndicated financial securities markets publication of former Senior Equity Analyst Markos N. Kaminis. Our stock market blog reaches reputable publishers & private networks and is an unbiased, independent Wall Street research resource on the economy, stocks, gold & currency, energy & oil, real estate and more. Wall Street & Greece should be as honest, dependable and passionate as The Greek.


Wall Street, business & other videos updated regularly...

Seeking Alpha

Tuesday, September 25, 2012

Consumer Confidence is Hopeful at Best

hope and prayer
In my report, Consumer Stocks Face Dangerous Stopper, I wrote, “I am expecting the Conference Board's measure to mark improvement, so be at ease.” Today, the Conference Board reported its Consumer Confidence Index gained nine points in September on its way to an index mark of 70.3. The consumer mood tracked the rise in stocks through the month (SPDR S&P 500 (NYSE: SPY) up 3.7%), and probably likewise benefited from reassurance by the European Central Bank (ECB) and expectations for a dovish Federal Reserve action which later followed.

famous economist
Our founder earned clients a 23% average annual return over five years as a stock analyst on Wall Street. "The Greek" has written for institutional newsletters, Businessweek, Real Money, Seeking Alpha and others, while also appearing across TV and radio. While writing for Wall Street Greek, Mr. Kaminis presciently warned of the financial crisis.

Consumer Confidence

Because the cutoff date for the survey was September 13, it only benefited ever so slightly from the Federal Open Market Committee (FOMC) monetary policy announcement and quantitative easing declaration. Still, it obviously benefited from the buildup of expectations for it through the month. Along with stocks, I believe it also has Mario Draghi and his creative and aggressive action, which I believe has effectively mitigated the European debt crisis (note, the economic crisis goes on), to thank. Of course, the mood of consumers is going to be less closely tied to the direct actions of the ECB at close proximity to those actions, and more responsive to the effects of those actions. It will more immediately be driven by the gains of capital markets and stocks, given the widespread ownership of them through retirement savings accounts.

“The whim of hope is represented here without a trace of tangible prosperity to anchor to.”

However, the consumer confidence gain, while hinged on the rise of forward looking equities and not on the employment situation or the pace of GDP, is superficial. The same superficiality applies for stock valuations in my opinion. You can see the consumer superficiality in the details of the report itself and in anecdotal data about the economy and corporate outlook. The Expectations Index, a measure of forward looking feelings for consumers, gained by 12.6 points on its way to a mark of 83.7. The whim of hope is represented here without a trace of tangible prosperity to anchor to.

The Present Situation Index, which better reflects how things really are today among Americans, also gained, but by only 3.7 points to a still unimpressive level of 50.2. And when you look more deeply into where specific surveyed issues ranked and what little the “improvement” actually means, you understand how hopeful this index really is today.

Surveyed Issue
Level
Change
Business Good
15.5%
+0.2%
Business Bad
33.3%
-1.0%
Jobs Plentiful
8.3%
+1.1%
Jobs Hard to Get
39.9%
-0.7%
Business to Improve
18.2%
+1.5%
Business to Worsen
13.8%
-3.8%
Expect More Jobs
18.5%
+2.7%
Expect Less Jobs
18.5%
-5.2%


In my view, consumers are less relevant respondents with regard to forward looking information. I think this is evident in the relatively lower overall response rate to the last four rows of the survey topics depicted above here. Also, they are nearly evenly divided on forward looking issues, and certainly less opinionated with regard to the outlook, which may simply reflect uncertainty. Uncertainty, in and of itself, is bad for equities, and probably to some lesser degree, also bad for consumer spending. Looking at the jobs and business questions for the present time, sentiment improved, but remains at absolutely poor levels.

Another report also issued today showed real consumer spending softening. The weekly chain store sales data reported by the International Council of Shopping Centers (ICSC) showed a week-to-week sales gain of just 0.6% in the period ending September 22nd, and that followed the prior week decline of 2.5%. Now these data may be holiday impacted, but the year-to-year change was also relatively unimpressive at +2.9% (last week it was +2.1%). The rate of growth barely edges inflation, with the latest Consumer Price Index showing price rise of 1.9% year-to-year in August, excluding food and energy price change. Redbook reported year-to-year chain store sales today up just 2.0%.

Anecdotal evidence among a significant number of companies shows a tighter competitive environment, as consumers selectively choose within perhaps saturated retail capacity. In tight economic conditions, if shopping activity loses robustness, then there will be less pie to share among competitors. For this reason, companies like J.C. Penney (NYSE: JCP) and Sears (Nasdaq: SHLD) are finding difficult times and resolving to profound change in operating strategy. For this reason, shoppers are gravitating towards lower cost value store options, driving market share gains for the likes of Wal-Mart (NYSE: WMT), eBay (Nasdaq: EBAY), Amazon.com (Nasdaq: AMZN) and Dollar Tree (Nasdaq: DLTR).

So, despite this latest consumer confidence swing, I suggest investors look toward more tangible evidence of consumer spending, like that seen in the chain store sales data. This Friday, an even better measure of the consumer mood will be reported. Look toward the Personal Income & Outlays data, and what it says about real consumer spending, excluding the impact of price change, for a better guide into the state of mind of American consumers.

Please see our disclosures at the Wall Street Greek website and author bio pages found there. This article and website in no way offers or represents financial or investment advice. Information is provided for entertainment purposes only.

Labels: , , , , , , ,

free email financial newsletter Bookmark and Share

Friday, September 14, 2012

Retail Sales Report for August Crimped by Gas Prices

retail sales gas
In a day offering the first real test for stocks since the latest Federal Reserve quantitative easing program, with five economic reports on the slate, Retail Sales led the opposition. You would have thought that retail sales growth of 0.9% on the month, a Street beating figure (consensus at +0.8%), would be good news. However, as always, I’m here to put the report under the microscope and show you why it is not.

consumer blog
Our founder earned clients a 23% average annual return over five years as a stock analyst on Wall Street. "The Greek" has written for institutional newsletters, Businessweek, Real Money, Seeking Alpha and others, while also appearing across TV and radio. While writing for Wall Street Greek, Mr. Kaminis presciently warned of the financial crisis.

While sales beat Wall Street on the headline, our survey of the report shows that to prove misleading. The first important point to make is that Retail Sales for the month before (July) were revised lower, to +0.6%, from +0.8% when reported initially. The effect of lowering your basis for comparison is to raise the percentage gain for the current period if the result comes close to being in line. Thus, unlike the percentage change superiority over the economists’ consensus, you bet your bottom dollar that the absolute forecast figure for the consensus is closer to the absolute real result for August.

The second point I want to make is that this data does not adjust for price changes, and so is influenced by price changes, including in volatile food and energy. Thus, when we take out the sales of autos and gasoline, we find that those sterilized retail sales only increased by 0.1%, against the revised higher July gain of 0.9%. Wall Street is not stupid, and so incorporated the monthly increase in gasoline prices to find an adjusted expectation for a 0.4% gain here. Obviously, that’s still too high and so the result is a disappointment on all counts.

Looking within this data, we see the catalyst is not autos. Ex-auto sales still increased 0.8% in August, off the unadjusted prior increase of 0.8% in July. So, you can contain your concern for Ford (NYSE: F) and General Motors (NYSE: GM) that might have been tied to this report. Those two stocks were up in the early going, probably because of market focus on this line detail.

However, gasoline station sales gained sharply on the higher price of gas in August. Those sales rose 5.5% against July, driving the top line of companies like The Pantry (Nasdaq: PTRY), but also of course Exxon Mobil (NYSE: XOM) and Chevron (NYSE: CVX).

stefana
Retail trade sales, which is what most people think about when they hear this report cited, increased by 0.9% in August, against the 0.7% gain in July. However, we’ll need to once again focus on the specific types of sellers to really glean anything important for the stocks you own. General Merchandise Store sales declined by 0.3% in August, after a 0.1% increase in July. While this category would include Wal-Mart (NYSE: WMT), it also includes non-discount department stores like Sears (Nasdaq: SHLD), Macy’s (NYSE: M) and J.C. Penney (NYSE: JCP). Though department store sales, when broken out, rose 0.1% in August, against their 0.8% gain in July. I think that what this data is telling us is that the pie shrinking and so there will be winners and losers when these companies next report earnings.

Ahead of the new Apple (Nasdaq: AAPL) iPhone release, the sales of Electronics and Appliance Stores like Best Buy (NYSE: BBY) fell by 1.4% in August, versus their 1.0% gain in July. Obviously, things will change as we incorporate the new iPhone into forward sales.

Supporting the case for homebuilders and renovators, the sales of Building Material and Garden Equipment Supplies Dealers like Home Depot (NYSE: HD) increased by a solid 1.0% in August, following the 1.2% gain made in July.

Food and beverage sellers, including grocery stores, saw sales unchanged in August. Without incorporating any change in food prices in the month, this could be due to less eating out at casual dining establishments like those provided by Brinker International (NYSE: EAT) and Darden (NYSE: DRI) restaurants. With regard to grocery, Wal-Mart is gaining share from traditional markets like those provided by Supervalu (NYSE: SVU) and Kroger (NYSE: KR).

Clothing and accessories stores like Abercrombie & Fitch (NYSE: ANF) and The Gap (NYSE: GPS) may not have gotten a good enough lift from back-to-school shopping, given the segment’s sales declined 0.1% against July. Of course, this is also going to be a fashion and smaller pie story, with some stores gaining as others lose customers.

Non-store retailers, including some of America’s favorite destinations like eBay (Nasdaq: EBAY) and Amazon.com (Nasdaq: AMZN) saw no change in August sales, against a 1.9% increase in July. We might pin the July gain to the heat, keeping consumers in their air conditioned homes, shopping away on their laptop. August is a holiday period, but no change is unexpected here, given the heat and also back-to-school. Perhaps consumers don’t have time to wait for shipping, or be home to receive during the vacation period ahead of the start of school, but that’s just speculation. We’ll have to wait on September to know for sure.

All in all, August looks like a disappointment for retail sales in my estimation, save perhaps the auto industry and gasoline providers, and also the construction materials peddlers. It may be the higher price of gasoline that hurt the rest of the sector. As it looks like gasoline prices are only going higher from here, given geopolitical fires and capacity constraints, not much should change for the better. The consumer mood is deteriorating on a once again apparently weakening domestic economy. In conclusion, this report supports my case for the spread of recession to our shores not too long from now.

Please see our disclosures at the Wall Street Greek website and author bio pages found there. This article and website in no way offers or represents financial or investment advice. Information is provided for entertainment purposes only.

Greenwich Village New York

Labels: , , , , , , ,

free email financial newsletter Bookmark and Share

Thursday, September 13, 2012

Real Jobless Claims Rise Is Coming

jobless claims
By "The Greek"

Weekly Initial Jobless Claims were reported today for the period ending September 8, 2012. Claims surprisingly jumped by 15,000, reaching back upward to 382K. It was a leap from a revised prior week count of 367K, which was hiked up by 2,000 from its initial reporting. It was distressing news on the surface, but perhaps to your surprise, this time I’m quelling concerns. The week’s data was impacted by a nonrecurring event and seasonal influence.

The first factor was even noted in the report itself, as Tropical Storm Isaac apparently drove at least 9,000 individuals to the unemployment line. When a bad storm floods or otherwise damages a building, it oftentimes also disrupts a business operation. Given that unemployment insurance is available, businesses can reduce their expenses as they repair and rebuild. Employees who are laid off are neither left in the breach, but insured.

The second factor was not mentioned in the report but likely plays a role in filings around this time of year. The long Labor Day holiday weekend could have disrupted the flow of new filings in one way or another. Thus, we cannot read too much into data around holidays generally, despite their being adjusted for by the reporting agencies.

The four-week moving average of new claimants increased by 3,250 this week to 375K. The insured unemployment rate measured 2.6% in the period ending September 1, unchanged from the week before. The number of insured unemployed Americans declined by 49,000 during the same week, to 3.28 million. The number of Americans receiving benefits of some sort for their unemployment, including through the extensions program, fell by 78,465, to 5.39 million in the period ending August 25. At this point, I reiterate that it is clear now that a great portion of the people falling off of this count are simply running out of coverage, and then falling off the radar.

Employment services firms are most closely tied to this report and the shares of Robert Half International (NYSE: RHI), Monster Worldwide (NYSE: MWW), Manpower (NYSE: MAN) and Kelly Services (Nasdaq: KELYA) are mostly higher today, but there’s too much noise in the news flow to really say this is why.

Company & Ticker
Today’s Change So Far
Robert Half (NYSE: RHI)
Unchanged
Monster Worldwide (NYSE: MWW)
+1.1%
Manpower (NYSE: MAN)
+1.7%
Kelly Services (Nasdaq: KELYA)
+0.5%


The jobless claims report was quickly overcome by the highly anticipated action of the Federal Reserve’s Federal Open Market Committee (FOMC), and so stocks moved decidedly higher from 12:30 PM EDT. The impact of this negative news would have been questionable anyway, given the nonrecurring drivers. However, over the coming months, I continue to expect this data point to reach above 400K again and to drive stock selling on some Godforsaken Thursday morning.

For this reason, and because of ongoing domestic and global economic deterioration and rising geopolitical impact, once the steam is used up from the central bank driver moving stocks again today, I would gradually move out of equities. The SPDR S&P 500 ETF (NYSE: SPY) is up 1.2% at this hour and 14.6% since June 1st and yet the American and global economies are slowing, and corporate earnings are being reconsidered. This can only last so long. I would gradually reduce holdings in stocks and the SPY, but continue to favor gold.

Please see our disclosures at the Wall Street Greek website and author bio pages found there. This article and website in no way offers or represents financial or investment advice. Information is provided for entertainment purposes only.

Labels: , , ,

free email financial newsletter Bookmark and Share

Friday, September 07, 2012

Jobs Report Favors Romney

labor market
Last evening, after President Obama gave his speech to the Democratic Party delegates in Charlotte, pundits speculated about how long a post party high might last, and what could kill it as quickly as today. The main suspect likely to assault the electorate mood was the monthly Employment Situation Report, which was just reported this morning at 8:30 AM EDT. In my view, the jobs report reflects a deteriorating economy and thereby favors Mitt Romney.

independent economist
Our founder earned clients a 23% average annual return over five years as a stock analyst on Wall Street. "The Greek" has written for institutional newsletters, Businessweek, Real Money, Seeking Alpha and others, while also appearing across TV and radio. While writing for Wall Street Greek, Mr. Kaminis presciently warned of the financial crisis.

Jobs Report


Some will key on the two-tenths of a point improvement in the unemployment rate to 8.1%, from 8.3% last month, but such reports should be quickly overcome by the realization that labor participation, not job creation, played the key role there. Stock futures turned lower at the breaking of the news, but it may take some time for the real message of the report to be understood; the SPDR S&P 500 ETF (NYSE: SPY) is fractionally higher at the hour of publishing here, while the Dow Jones Industrial Average ETF (NYSE: DIA) is less enthused due to the details of the data discussed below. The NASDAQ also has the earnings warning of Intel (Nasdaq: INTC) to digest this morning, and so the PowerShares QQQ (Nasdaq: QQQ) is sinking. But what is holding up stocks generally today is the increased likelihood of Federal Reserve action later this month. What is gaining ground today is gold against the dollar, as the SPDR Gold Shares (NYSE: GLD) gains 1.6% into early trade.

Job creation, depicted by a 96,000 net increase in nonfarm payrolls, came in under July’s revised rate of 141K (from 163K) and the economists’ consensus for 125K. Within the overall figure, private nonfarm payrolls only rose by 103K, versus July’s revised figure of 162K (from 172K). Take note of the direction of the revisions as well as the disappointment produced by the figures for August.

Debunking the unemployment rate was not hard to do this morning, despite the details of the report showing the number of unemployed Americans was down by 250K in August, to 12.54 million. Rather, the Household Survey shows the civilian labor force dropped sharply by 368K in August, even as the population was estimated higher by 212K. The same survey showed the number of employed Americans was down by 119K. Clearly, a big chunk of that improvement in the unemployed (if not all of it) was due to the continued drop-off of the long-term unemployed out of the labor force, not because people got jobs. Otherwise, the number of employed Americans should have risen.

As we look deeper into the data, we see that the number of long-term unemployed Americans (27 weeks of joblessness or more) decreased by 152K in August. There is a huge segment of the American population that is simply being lost into limbo. Who knows where they go, perhaps to homelessness, to prison, hospitals of one sort or another, to other parts of the world, or into their parents’ basements to drift into deep depression. Maybe a few are starting small businesses, self-publishing books, or earning income off the books in one way or another, but it’s clear that the majority are not faring well enough.

Some are working part-time instead of full-time, as the number of part-timers for economic reasons (meaning they want more hours) decreased by 215K in August, to 8.03 million. The number of those who have chosen part-time work (some of these likely didn’t understand the survey question) rose by 130K. I say that because school just started, and I believe less young people are likely to seek part-time work when attending school, though some returning from long vacations may be seeking work. Perhaps in today’s economy, a greater number of young people are finding resources from home harder to come by, and must therefore work while earning their degree.

The number of Americans marginally attached to the labor force, meaning they did not aggressively seek work over the last four weeks, increased by 32K. Within this segment, the number of discouraged workers, or those people who believe there are no more jobs available for them any longer, decreased slightly by 8,000.

Under-Employment Rate
The calculation of the under-employment rate, which takes into account the number of Americans working part-time for economic reasons and the detached workforce, follows here. If we add back the excluded 2.561 million displaced workers to the labor market, and include the 8.031 million underemployed part-timers in the unemployed count, adjusted unemployment reaches ((12.544M + 2.561M + 8.031M) / (154.645M + 2.561M)) * 100 = 14.7%. Last month, the rate was ((12.794M + 2.529M + 8.246M) / (155.013M + 2.529M)) * 100 = 15.0%. Don’t be fooled by what looks like an improved rate of underemployment to go along with the gain in the unemployment rate, because this figure, like the other, leaves out the unexplained decrease in the civilian workforce. Where have those unaccounted for Americans gone? Please tell me if you know, because they are not in this tally.

The details of the Establishment Survey show total private (not including public sector) jobs increased by a net 103K in August. That was significantly under ADP’s estimate for 201K, which helped support the stock market Thursday. It was likewise inconsistent with the decline in Challenger’s Monthly Job-Cuts data. What it did reflect, was something I’ve been warning about, a decrease in manufacturing employment. That segment of the economy dropped 15K jobs in August, and while jobs are not being shed by Boeing (NYSE: BA) as yet, layoffs are increasingly being considered at cyclicals like General Electric (NYSE: GE), Caterpillar (NYSE: CAT) and Cummins (NYSE: CMI). The entire goods-producing segment of the economy shed 16K jobs, with most of those coming in durable goods. There was even a 7,500 drop at motor vehicle and parts makers like Ford (NYSE: F), General Motors (NYSE: GM) and Magna International (NYSE: MGA).

Private sector service providers added a net of 119K jobs in August, according to the survey. The majority of those came in Leisure & Hospitality (+34K), Professional & Business Services (+28K) and in Healthcare & Social Assistance (+21.7K). Services declines were only found in Temporary Help (-4.9K), which marked a reversal of recent months and was bad news for Kelly Services (Nasdaq: KELYA) today.

The Retail Trade industry added 6.1K jobs in August, I expect due to increases at discounters like Wal-Mart (NYSE: WMT), Target (NYSE: TGT) and Costco (Nasdaq: COST), at the cost of underperformers like J.C. Penney (NYSE: JCP) and Sears (Nasdaq: SHLD). Information only added 3,000 jobs in August; so much for the impact of the Internet newcomers like Facebook (NYSE: FB) and Yelp (Nasdaq: YELP). The public sector shed 7,000 jobs in August, down from 21K in July and 18K in June.

On net, I think there’s no doubting that this report favors Mitt Romney, because when the workforce change is understood, it reflects a deteriorating economy. I expect these reports are going to get worse in the next two months ahead of the election. The Democrats will focus on the unemployment rate today, but I expect the Republicans will not have to explain that anomaly as the months progress and the economy deteriorates further.

Please see our disclosures at the Wall Street Greek website and author bio pages found there. This article and website in no way offers or represents financial or investment advice. Information is provided for entertainment purposes only.

stock market blog

Labels: , , , , , , , , ,

free email financial newsletter Bookmark and Share

Tuesday, September 04, 2012

ISM Manufacturing Report Raises Alarm

alarmed traders
The light-hearted in economic denial received a wakeup call this morning. As we return from the long holiday weekend, perhaps feeling good about our lives and maybe even the economy, the first economic report to reach the wire offers a slap in the face. ISM’s Manufacturing Index for the month of August, reported Tuesday morning, deteriorated even deeper into territory reflecting sector contraction. While ISM disagrees that it means economic recession, it cannot deny that the situation has deteriorated. As I surveyed the data, I see only signs for concern.

bearish blogger
Our founder earned clients a 23% average annual return over five years as a stock analyst on Wall Street. "The Greek" has written for institutional newsletters, Businessweek, Real Money, Seeking Alpha and others, while also appearing across TV and radio. While writing for Wall Street Greek, Mr. Kaminis presciently warned of the financial crisis.

ISM Manufacturing Report


ISM’s Manufacturing Report on Business for the month of August 2012 produced a headline index, the Purchasing Managers Index (PMI), of 49.6%. Readings below 50.0 reflect sector contraction, and this reading also marked deterioration from July’s 49.8 level. Economists, perhaps having had one too many pina coladas this past weekend, were looking for a reading of 50.0, or improvement. Stocks, which started the day lazily without direction, turned decidedly lower after the report. The SPDR S&P 500 ETF (NYSE: SPY) was down a half point just a few minutes after the release.

August marked the third consecutive month of economic contraction within the manufacturing sector, and this latest reading was the lowest since July 2009. The measure is therefore marking a tough trend. And the deeper we look into the details, the worse signs we find of an economic red tide.

The New Orders Index, a forwarding looking component, dropped significantly to 47.1, down 0.9 from a level of 48.0 in July. This signifies contraction at a faster pace than seen in July, and clearly reflects poorly on global demand for American made goods. The Backlog of Orders Index fell to a sickly 42.5, from 43.0 in July. So, new orders and order backlogs were deteriorated; this is obviously disconcerting. Customers’ Inventories fell a half point to 49.0, but that signifies customers holding less inventory then they should. It also shows a higher level of anxiety among customers of surveyed purchasing managers. Purchasing managers’ inventories are stacking up, with that index now reading 53.0, from 49.0. Given the trends in order backlogs, it’s difficult to see this as a positive.

Production fell 4.1 points, to 47.2, and signs are building that layoffs may be around the corner. This ended a streak of growth that crossed several years. With production lagging, you have to then wonder about employment. The Employment Index eased to 51.6, from 52.0, as the lagging indicator starts to see impact. Take note, as this was the lowest reading for the index since November of 2009. Global demand for American goods remains soft, as the Export Index reached 47.0, up 0.5 points from July, but still reflecting contraction. Imports fell 1.5 points, to 49.0.

There’s no denying any longer that the global disease founded in Europe is spreading to our shores. Eight of eighteen industries are reporting contraction now, as eight report growth and two were unchanged. Anecdotal evidence supports the case we’ve made as panel participants mostly expressed concern about global economies and noted decreased demand for goods.

Only prices seemed to be rising, which is obviously not healthy when demand is declining. Some of the respondents indicated that the drought in the U.S. affected prices in August. Certainly, corn prices increased in August, but fuel prices did as well. Industrial metals continued to mostly decline in price, with nickel, copper, aluminum and steel lower. These are bad signs for the likes of Alcoa (NYSE: AA), BHP Billiton (NYSE: BHP), Rio Tinto (NYSE: RIO), Vale S.A. (Nasdaq: VALE) and Freeport McMoRan Copper & Gold (NYSE: FCX). Investors are not missing that point today either.

Company & Ticker
Midday Price Change
Alcoa (NYSE: AA)
-1.4%
BHP Billiton (NYSE: BHP)
-1.2%
Rio Tinto (NYSE: RIO)
-1.5%
Vale (Nasdaq: VALE)
-2.6%
Freeport-McMoRan (NYSE: FCX)
-1.6%


Industrials are down in concert, with the Dow Jones Industrial Average Index ETF (NYSE: DIA) off 0.8% and the Industrial Select Sector SPDR (NYSE: XLI) off 1.4% at the hour of scribbling here. Major manufacturers are split, depending on industry, with General Electric (NYSE: GE) down 0.7%, Caterpillar (NYSE: CAT) off 3.1% and Ford (NYSE: F) higher by 1.0%, as autos report monthly sales.

I advised on the sale of industrial stocks and basic materials shares two months ago. In the near-term, there may be some lift ahead of and into the September Federal Open Market Committee meeting. After that, I expect global deterioration will only accelerate, especially if geopolitical triggers are pulled as I also expect.

What we’ve recorded here is the worst of the last three months’ contraction in the overall PMI and the New Orders Index. It is therefore a bad sign for the economy, but because the manufacturing sector represents a small portion of the economy, historically, it has not been associated with recession at similar levels. Still, I think the writing is on the wall and deterioration is evident. In my view, layoffs will be the next news driver from the sector, though perhaps not as soon as Friday’s employment report. Construction would seem to be offering a stabilizing factor, but the latest data reported today for the month of July showed a 0.9% drop in construction spending. So, all the news is bad today for the economy, and stocks are pulled by that red tide.

Please see our disclosures at the Wall Street Greek website and author bio pages found there. This article and website in no way offers or represents financial or investment advice. Information is provided for entertainment purposes only.

cake boss NYC

Labels: , , , , ,

free email financial newsletter Bookmark and Share

Thursday, August 30, 2012

Weekly Initial Jobless Claims Report

weekly initial jobless claims report
Initial Weekly Jobless Claims were reported this morning for the period ending August 25, 2012. The latest data showed claims stuck at 374,000 through the period, ahead of economists’ expectations for 370K, though matching the prior week’s flow of claims. However, the four-week moving average shows jobless claims continued to creep higher, with the average up 1,500, to 370,250. The close of August is a slow period for all business activity, especially just ahead of the Labor Day weekend. Over recent weeks, I’ve been warning that the claims count should creep back up over 400K, leading to one fateful Thursday morning stock selloff. Thus, I half jokingly stated, “Sell Stocks on Wednesday Afternoons” as a trading strategy. September and October are shaping up as a more likely time for a shift toward that end.

The Claims Report showed insured unemployment unchanged at 2.6% for the lagged period ending August 18. The number of people insured and unemployed decreased by 5,000 and numbered about 3.3 million people. The four-week moving average for insured unemployment increased by 9,000, and was a bit higher than the weekly data indicated. The number of Americans covered by some sort of benefit, including through the extensions program, decreased by 62,253 in the period ending August 11, to 5.5 million. Of course, this figure decreases for more than one reason, as Americans fall out of qualification for benefits and as a few of them actually get jobs.

The shares of employment services firms pay close mind to the weekly data, and are curiously lower today despite the lack of change.

Company & Ticker
Thursday’s Start (10 AM)
Robert Half (NYSE: RHI)
-1.1%
Korn Ferry (NYSE: KFY)
-0.7%
Monster Worldwide (NYSE: MWW)
-1.3%
Manpower (NYSE: MAN)
-1.1%
Kelly Services (Nasdaq: KELYA)
-0.7%


If I’m right, America’s largest employers will likely be doing most of the firing, but only because they employ the most people per company. In actuality, America’s small businesses are the most important of our employers. The largest employers are by no coincidence also companies that provide value services or necessities, including Wal-Mart (NYSE: WMT), McDonald’s (NYSE: MCD), Target (NYSE: TGT) and Kroger (NYSE: KR).

This week’s leading layoff newsmakers, either firing, planning cuts or rumored to be about to declare layoffs included Lexmark International (NYSE: LXK), Schnitzer Steel Industries (Nasdaq: SCHN), Boston Scientific (NYSE: BSX), Lockheed Martin (NYSE: LMT), RealNetworks (Nasdaq: RNWK), Rockwell Collins (NYSE: COL) and Sony (NYSE: SNE).

For your information, I often like to include the individual state and territorial information from the report:

The highest insured unemployment rates in the week ending August 11 were in Puerto Rico (4.4), the Virgin Islands (4.1), Pennsylvania (3.9), New Jersey (3.8), Connecticut (3.6), Alaska (3.6), California (3.4), Rhode Island (3.1), New York (3.0), and Nevada (3.0).

The largest increases in initial claims for the week ending August 18 were in Michigan (+2,383), Florida (+1,558), Colorado (+781), South Carolina (+774), and Texas (+517), while the largest decreases were in California (-5,549), Ohio (-1,379), Oregon (-1,098), Wisconsin (-539), and Virginia (-480).

Please see our disclosures at the Wall Street Greek website and author bio pages found there. This article and website in no way offers or represents financial or investment advice. Information is provided for entertainment purposes only.

Labels: , , ,

free email financial newsletter Bookmark and Share

Tuesday, August 28, 2012

ICSC & Redbook Same-Store Sales Reported Soft

depressed shopper
The weekly flow of same-store sales, as measured by the International Council of Shopping Centers (ICSC) and Redbook have offered really ugly insight into consumer spending of late. The importance of consumer spending in the United States cannot be understated. Unfortunately, it is slipping, as I pointed out in “Recession’s Key Ingredient Added” and “Glaring Recession Signal – Consumer Spending Stops”.

shopping bloggers
Our founder earned clients a 23% average annual return over five years as a stock analyst on Wall Street. "The Greek" has written for institutional newsletters, Businessweek, Real Money, Seeking Alpha and others, while also appearing across TV and radio. While writing for Wall Street Greek, Mr. Kaminis presciently warned of the financial crisis.

This week’s data from the ICSC showed same-store sales inched higher by just 0.5% in the week ending August 25, 2012. That embarrassing growth came on a prior week decline of 1.5%. And this is during a period within which consumers are supposed to be shopping for back-to-school needs. If you go back over the weekly data through the past several months, you find a soft trend that in my estimation reflects a path toward recession.

On a year-over-year basis, the ICSC reported same-store sales growth of 3.4%, which marked improvement over the prior week’s 3.1% growth. While this rate is decent, in weeks past we’ve seen growth under the rate of inflation, which clearly implies economic contraction. Redbook reported the year-to-year rate at 1.5% this week, versus 1.9% last week. Each of those rates reflect a slower pace than inflation, and are inadequate to meet current mainstream economic projections (not mine obviously).

I don’t believe we have to look too far for anecdotal evidence of consumer softness either. Even high-end retailer, Tiffany (NYSE: TIF), cautioned on the outlook yesterday after reporting short of Wall Street expectations. Tiffany’s shares rose yesterday, get this, partly on a lesser same-store sales decline (-1%) than was expected by analysts (-4%).

Others like J.C. Penney (NYSE: JCP) are suffering because of poorly timed dramatic change at a time of economic question. The discounters are all the rage today; I even noted Mitt Romney and his wife bragging about buying some shirts at Costco (Nasdaq: COST), perhaps in an effort to fit the economic reality of most Americans. It is the best price sellers like Wal-Mart (NYSE: WMT), Amazon.com (Nasdaq: AMZN), eBay (Nasdaq: EBAY) and Dollar Tree (Nasdaq: DLTR) which are doing best today. That’s something I pointed out through several articles over recent months, including “5 Stocks to Own if Consumers Check Out”. It is because they sell things cheapest at a time when more Americans value price most.

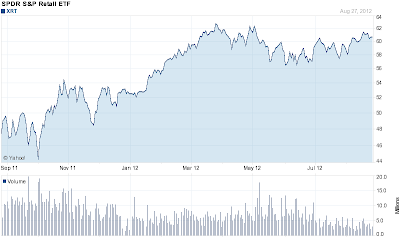
The one-year chart of the Consumer Discretionary Select Sector SPDR (NYSE: XLY) does not reflect the environment I just highlighted. Thus, it illustrates an environment within which many stocks are likely vulnerable.

XLY chart
Charts by Yahoo Finance

The SPDR S&P Retail (NYSE: XRT) offers the same view.

XRT chart

At 10:00 AM EDT this morning, the Conference Board reported Consumer Confidence dropped like a rock, to 60.6, from 65.9 at last check. That should be no surprise to readers of my recent write-up, “Regarding the Consumer Sentiment Celebration – I’ll Pass”, but it’s waking some folks up to the truth today. Stocks are moving lower since the 10 AM release, with the SPDR S&P 500 (NYSE: SPY) indicating lower fractionally. Take heed fellow investors because if the consumer is checking out as I see it, a rude awakening is in store for the second half economy and the stock market.

Please see our disclosures at the Wall Street Greek website and author bio pages found there. This article and website in no way offers or represents financial or investment advice. Information is provided for entertainment purposes only.

Orthodox wedding crowns

Labels: , , , , ,

free email financial newsletter Bookmark and Share

Monday, August 27, 2012

Durables Orders Show Damaged Goods

durable goods orders report
Durable Goods Orders offer important insight into the demand for higher ticket items meant to last for multiple years. These purchases are reflective of economic realities, as they will receive great consideration because of the substantial amount of capital involved. The time from order to delivery could be extensive as well, and so purchasers need to be relatively certain of their business outlook.

manufacturing industry analyst
Our founder earned clients a 23% average annual return over five years as a stock analyst on Wall Street. "The Greek" has written for institutional newsletters, Businessweek, Real Money, Seeking Alpha and others, while also appearing across TV and radio. While writing for Wall Street Greek, Mr. Kaminis presciently warned of the financial crisis.

Durable Goods Orders


As a result, econo-watchers benefit from following the report because of the sensitivity of such spending to economic conditions. Oftentimes, because of the high ticket price of these items, the change from month to month can fluctuate substantially and offer a noisy perspective into the economy. As a result, some dismiss the changes and even brush off the monthly datapoint as a volatile measure when it doesn’t fit their forecast. However, after reviewing the durable goods order data for July, it is clear that this one is not dismissible.

Business was strong on the top line, with new orders rising 4.2% overall in July, well ahead of economists’ expectations for a lesser 1.9% increase, based on Bloomberg’s survey. The result also marked the third consecutive month of increase, adding, for some, even more reason to cheer. However, when excluding transportation, new orders actually declined by 0.4%, which matched poorly against the expectation for a 0.4% increase. The difference was the result of the substantial 14.1% increase in orders for transportation equipment. Much of those gains were pinpointed to Boeing (BA), as non-defense orders for aircraft and parts increased by 54%. Again, I note that because of the high ticket price of these products, a few more or less month-to-month can make a big difference.

The important take away is that when excluding the aircraft orders, the business outlook was quite different. What’s also clear is that businesses are not investing significantly enough due to a feeling of uncertainty about what’s to come, but also due to a tangible easing of consumer spending. Illustrating this, new orders for capital goods excluding defense and transportation declined 3.4% in July, after dropping 2.7% in June. It means businesses are not spending, and that reflects poorly for the economy on the whole.

Looking even more deeply into the details of the data, we find that machinery orders were down 3.6% in July, following a 2.5% drop in June. This follows in the natural progression of deterioration in manufacturing, and may precede layoffs for the sector. Regional data and the national ISM manufacturing data have begun to show a changing mood regarding employment for the sector, which follows downgraded expectations and softening business. So for the big industrial players like General Electric (GE), Caterpillar (CAT) and others, the report may hold special significance. As far as the sector is concerned, the last year’s performance of the Industrial Select Sector SPDR (XLI) seems to reflect a vulnerable group.

chart industrial select sector SPDR XLI
Chart by Yahoo Finance

New orders for computers and related products increased by 3.7% in July after declining by 4.7% in June. That’s inconsistent with the latest results from Dell (DELL) and Hewlett-Packard (HPQ), and also with views that potential buyers are waiting on Microsoft’s (MSFT) Windows 8 release. Orders for communication equipment fell 4.0% in July after a 7.4% decrease in June. That’s consistent with the caution provided by Cisco Systems (CSCO) in its discussion post earnings this last month.

New orders for motor vehicles and parts rose by 12.8% in July, after a 0.7% decrease in June. That bodes well for Ford (F) and GM (GM), which considering my negative outlook for the big three Japanese automakers, Toyota (TM), Honda (HMC) and Nissan (NSANY.PK), offers all the more reason to consider a change in capital allocation within the sector.

In conclusion, the durable goods orders report, when excluding the volatile transportation results, reflects a market demanding less goods generally. Even before this report, purchasing managers have been indicating a changing mood reflecting more cautious spending patterns. This report offers important economic insight into the demand for durable goods but also for employment and spending generally, and for the economy on the whole. It implies that industrials should reflect the change in their reported operating results and guidance, and share performance. Finally, it supports my longstanding argument that the ills of Europe are in fact contaminating the vulnerable U.S. market as well as hampering the growth of the emerging world.

Please see our disclosures at the Wall Street Greek website and author bio pages found there. This article and website in no way offers or represents financial or investment advice. Information is provided for entertainment purposes only.

Labels: , , ,

free email financial newsletter Bookmark and Share

Saturday, August 18, 2012

Regarding the Consumer Sentiment Celebration – I’ll Pass

celebration champagne
Rejoice oh troubled masses of American investors, the consumer has been reported still living. Yes, the dead and depressed are walking and talking, and according to the headlines of the popular press, they are in a better mood for shopping too.

Greek American businessmen
Our founder earned clients a 23% average annual return over five years as a stock analyst on Wall Street. "The Greek" has written for institutional newsletters, Businessweek, Real Money, Seeking Alpha and others, while also appearing across TV and radio. While writing for Wall Street Greek, Mr. Kaminis presciently warned of the financial crisis.

The Thomson Reuters/University of Michigan Consumer Sentiment Index improved in mid-August to 73.6, from 72.3 in July (and 73.2 in June). This nascent revival broke a sorry streak of two consecutive months of deterioration for the data point. Apparently it was cause for celebration, as the SPDR S&P 500 (NYSE: SPY) pushed a bit further toward a 1.0% gain for the week. The celebration was more clearly seen in Friday’s 0.4% gain of the Consumer Discretionary Select Sector SPDR (NYSE: XLY) and the 0.7% rise of the SPDR S&P Retail (NYSE: XRT).

The measure of current economic conditions improved last month by 4.9 points, to 87.6. The latest stock market gains, as seen in the performance of the SPY, probably have something to do with that. The rise of the last couple months has continued a positive trend spanning the past year.

SPY YTD chart
Chart at Yahoo Finance

Yet, it would appear the gains of both stocks and consumer sentiment are based on a weak foundation, supported by hope in the world’s central banks. The fresh consumer report showed consumer expectations about the future are much more pessimistic than the feeling about today. The Expectations Index decreased to a lowly mark of 64.5, from 65.6 in July, as investors look forward to a fiscal cliff, global economic demise and maybe a complex war in the Middle East. Meanwhile, in the U.S., gasoline prices are rising, unemployment is not improving, and business investment is limited by economic and political uncertainty, with regulatory uncertainty tied to that. So, if you’ll excuse me, I’ll save my champagne for another day.

Retailers’ shares also benefited from the week’s Retail Sales data, which showed July’s retail sales gained 0.8% and rose 0.9% when excluding autos and gasoline. Each data point far exceeded economists’ consensus expectations, but that was at least partly due to their following revised lower June figures. The XRT gained 2.3% on the week nonetheless. Still, the news didn’t help the nation’s most important retailer, Wal-Mart (NYSE: WMT), which reported results that didn’t justify its premium valuation to growth expectations. Individual data dictated the direction of many retailers during this reporting period for the industry.

Investors bought stocks generally Friday on the consumer report and data showing the Leading Economic Indicators Index (LEI) improved in July. Equities were also supported by Angela Merkel’s nod to European Central Bank (ECB) support of the euro and troubled area bonds. Joining the SPY higher, the SPDR Dow Jones Industrials (NYSE: DIA) and the PowerShares QQQ (Nasdaq: QQQ) gained fractionally on the day Friday. Meanwhile, the dollar and gold held about steady, with the PowerShares DB US Dollar Index Bullish (NYSE: UUP) and the SPDR Gold Shares (NYSE: GLD) each inching forward. The price of crude rose Friday though, on Iranian President Ahmadinejad’s latest provocation. The iPath S&P GSCI Crude Oil TR Index ETN (NYSE: OIL) gained 1.2%.

In conclusion, while traders celebrate the headlines, I advise investors to take a pass on the party.

Please see our disclosures at the Wall Street Greek website and author bio pages found there. This article and website in no way offers or represents financial or investment advice. Information is provided for entertainment purposes only.

Labels: , , , , , ,

free email financial newsletter Bookmark and Share

Wednesday, August 01, 2012

ADP Report - The Boy Who Cried Wolf

the boy who cried wolf
The ADP Private Employment Report reached the wire this morning, and somebody somewhere just rolled their eyes. It’s because the data point, which is actually just an estimate that gets the attention of an important government report (or at least it once did), has tended to misfire and misguide from time to time (to be kind).

Markos Kaminis
Our founder earned clients a 23% average annual return over five years as a stock analyst on Wall Street. "The Greek" has written for institutional newsletters, Businessweek, Real Money, Seeking Alpha and others, while also appearing across TV and radio. While writing for Wall Street Greek, Mr. Kaminis presciently warned of the financial crisis.

ADP Report


The report for July showed ADP’s estimate for a private nonfarm payroll increase of 163K, which was higher than the economists’ consensus forecast for 120K. The problem is that none of the townspeople know if the wolf is really out there or not because of past performances. The SPDR S&P 500 (NYSE: SPY) is up a half point on this news, and against the weight of a poor manufacturing data point at ISM. With two days to the big government report, it’s worth your capital to wait anyway. The shares of employment services firms are indicating more worry than ADP gives reason for, with Robert Half (NYSE: RHI), Korn Ferry (NYSE: KFY), Manpower (NYSE: MAN) and Monster Worldwide (NYSE: MWW) all lower. Kelly Services (Nasdaq: KELYA), which specializes in temporary workers, is appropriately higher since temps are getting the nod in an uncertain environment.

Last month’s report showed ADP’s estimate for private employment growth was off a bit. The company estimated private employment increased by 172K (revised from 176K) in June, but the Employment Situation Report showed private employment actually rose by 84,000. ADP uses real payroll data, so maybe the government has it wrong, since it uses government employees to process the information. I would bet on both being wrong, and just take your key from the latest consumer spending stall, since unemployed people don’t buy stuff.

Let’s humor the boy and see what he’s yelling about up there on the hill; maybe the wolf is behind him and he doesn’t even know it. ADP’s latest data shows the service sector likely added 148K jobs while the goods producing sector added 15K. Manufacturing added just 6,000 jobs. Goods producing job additions represent 9.2% of the total additions here, which is a little less than the sector’s footprint on the economy. Therefore, it likely confirms the latest signs of recession we’ve seen in the manufacturing sector; remember jobs will lag. Then, today, ISM’s Manufacturing Index showed contraction for the second month in a row, with the index marking 49.8 for July. That said, ADP still has the sector adding jobs.

Small Businesses added the majority of jobs, with the addition of 73K on net in July. Medium sized businesses added 67K jobs, while large businesses hired 23K new people on net. The size categories are defined by number of employees, with “large” including companies of 500 employees or more. Small businesses are those with up to 49 employees. Small businesses do employ the majority of Americans and are properly represented here.

Anecdotally, you might find it interesting that construction added jobs for the second straight month, adding 5,000 in July. That offers support to companies like Jacobs Engineering (NYSE: JEC), KBR, Inc. (NYSE: KBR) and PulteGroup (NYSE: PHM). It all depends on what type of construction is going on, and I suspect a lot of it is around the development of natural gas reserves and distribution (or once Keystone moves forward). Some of it may be related to public infrastructure development in markets that can support that now, like say in Texas and North Dakota. And some of it might be from large publicly traded builders, now benefiting from the demise of smaller competition, and in some cases, development of multi-family unit facilities for our Renter Nation.

Surprise, surprise, financial services firms added 9,000 jobs in July; actually it was the 12th straight month of net job additions for the sector. I suppose the Facebook (NYSE: FB) IPO single-handedly played an important role in new hires at Morgan Stanley (NYSE: MS) and J.P. Morgan Chase (NYSE: JPM). As we all know, the large banks have been shedding jobs en masse, with Bank of America (NYSE: BAC), Citigroup (NYSE: C) and others seriously contracting their operations. I hear the banks are having to hire a bunch of people to manage all the claims against their mortgage writing operations though. Also, regionals like TD Bank (NYSE: TD) and PNC Financial (NYSE: PNC) are benefiting from the handcuffed operations at larger banks, so some hiring might be developing on the regional level. Sheriffs do not count as financial jobs, so all the hands-on foreclosure work is not accounted for there.

Commentary on the report offered wisely tempered enthusiasm from ADP’s President and CEO Carlos Rodriguez, who noted that a better and more consistent rate of job increases would be more meaningful. It was the 30th consecutive month of job gains, but the last three months of total nonfarm job growth dropped off significantly from Q1, so there’s a sense (obvious to some) that something might be changing for the worse.

Another commentary offered on the report suggested tentative hiring due to worry about European crisis and domestic fiscal policy. While that is certainly the case, the American economy is without a doubt feeling real and tangible impact from European recession and slowing China growth. Also, in the U.S., our economic recovery has been hobbled by the scars of the financial crisis, including jobs that will never come back and a burdened and damaged financial system. So, it’s pretty tangible, and should not be brushed off. In other words, the wolf really is out there.

Please see our disclosures at the Wall Street Greek website and author bio pages found there. This article and website in no way offers or represents financial or investment advice. Information is provided for entertainment purposes only.

Labels: , , , , , ,

free email financial newsletter Bookmark and Share