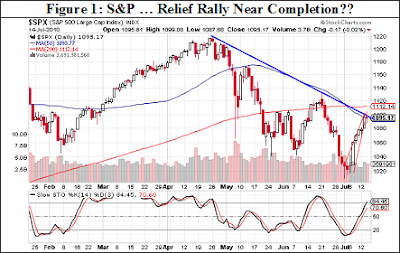
Bear Market Rally Near Completion

The Party Is Over
Wall Street Greek technical analyst Steven Ferguson offers his latest technical analysis and market outlook below. Mr. Ferguson suggests the belated bear market rally is near completion. He cites a series of technical indicators, including the infamous "death cross," which offer Greek readers ample warning of the threatening possibility of a stock market downturn. Mr. Ferguson also operates Systemata Corp., a model-based controls design firm.
(Tickers: NYSE: DIA, NYSE: SPY, Nasdaq: QQQQ, NYSE: DOG, NYSE: SDS, NYSE: QLD, NYSE: ICE, NYSE: NYX, Nasdaq: NDAQ, Nasdaq: MEMKX, Nasdaq: GECMX, Nasdaq: JEVOX, Nasdaq: PEMAX, NYSE: EEM, NYSE: VWO, Nasdaq: VEIEX, Nasdaq: ADRE, Nasdaq: PEBIX, Nasdaq: GMCEX, NYSE: MSF, NYSE: EEV, Nasdaq: REMGX, NYSE: GMM, NYSE: EDZ, AMEX: ETF, NYSE: FEO, NYSE: ESD, NYSE: MSD, NYSE: EMF, NYSE: TEI, Nasdaq: EMIF, NYSE: EFN, NYSE: EMT, NYSE: PCY, NYSE: PXH, NYSE: GMF, NYSE: GUR, NYSE: GML, NYSE: GMM, NYSE: EWX, NYSE: GAF, NYSE: EUF, NYSE: EET, Nasdaq: ABEMX, Nasdaq: AEMGX, Nasdaq: APERX, Nasdaq: PMGAX, Nasdaq: PMCIX, Nasdaq: AOTAX, Nasdaq: AOTCX, Nasdaq: AOTDX, Nasdaq: AEMPX, Nasdaq: AOTIX, Nasdaq: AEMEX, Nasdaq: AAMRX, Nasdaq: AEMFX, Nasdaq: AAEPX, Nasdaq: AEMMX, Nasdaq: ACKBX, Nasdaq: ACECX, Nasdaq: AMKIX, Nasdaq: TWMIX, Nasdaq: NDAQ, NYSE: PIZ, NYSE: PIE, NYSE: PDP, NYSE: IWM, NYSE: TWM, NYSE: IWD, NYSE: SDK, Nasdaq: HTOAX, Nasdaq: HTOTX, Nasdaq: HTOBX, Nasdaq: JTCIX, Nasdaq: JTCNX, Nasdaq: JTCAX)
Bear Market Rally Near Completion
 Since the last technical analysis installment, the S&P index dipped another 50 points for 4 successive days before rallying sharply, right at the projected "Phi Turn" date of July 1st. Following that, the S&P has indeed rallied back to the 50 day moving average as predicted. Alas, the level is now about 15 points lower than it had been at the time of our last article.
At present, we see that major indices are facing stiff upside resistance, even as earnings season heads into full swing.

From the chart in Figure 1, we observe the following:
- The 50 day moving average has now crossed below the 200 day moving average. This is the so-called "death-cross" which some treat as the defining indicator of bear market conditions
- Index closing prices have been stopped for the last two trading sessions right at the 50 day moving average
- If prices should penetrate that landmark level, the 200 day moving average looms above at 1112
- Prices have also been stopped by a downward trend channel which is further reinforced each time it acts as resistance
- The rally itself is forming a bearish rising wedge pattern (better observed on an intraday chart) that has a minimum downside target of approximately 1020
- Stochastic indicators, shown below the price chart, reveal a nearly overbought condition
- Heavy volume selling has accompanied the downtrend, while rallies have occurred on considerably lower volume
- Note finally that the 13 week moving average (not depicted) has touched the 34 week moving average, a condition that has reliably segregated bearish from bullish market conditions…this is a defining moment!
If the rally does continue and S&P prices break above the June 21st high of approximately 1140, it is very possible that the April 26th top at 1220 would eventually be taken out. However, this doesn't seem the most likely outcome as the week draws to a close and the index appears overbought even at 1100.
Greek readers should consider taking any trading profits from this recent rally.

Article may interest investors in Nasdaq: MEMKX, Nasdaq: GECMX, Nasdaq: JEVOX, Nasdaq: PEMAX, NYSE: EEM, NYSE: VWO, Nasdaq: VEIEX, Nasdaq: ADRE, Nasdaq: PEBIX, Nasdaq: GMCEX, NYSE: MSF, NYSE: EEV, Nasdaq: REMGX, NYSE: GMM, NYSE: EDZ, AMEX: ETF, NYSE: FEO, NYSE: ESD, NYSE: MSD, NYSE: EMF, NYSE: TEI, Nasdaq: EMIF, NYSE: EFN, NYSE: EMT, NYSE: PCY, NYSE: PXH, NYSE: GMF, NYSE: GUR, NYSE: GML, NYSE: GMM, NYSE: EWX, NYSE: GAF, NYSE: EUF, NYSE: EET, Nasdaq: ABEMX, Nasdaq: AEMGX, Nasdaq: APERX, Nasdaq: PMGAX, Nasdaq: PMCIX, Nasdaq: AOTAX, Nasdaq: AOTCX, Nasdaq: AOTDX, Nasdaq: AEMPX, Nasdaq: AOTIX, Nasdaq: AEMEX, Nasdaq: AAMRX, Nasdaq: AEMFX, Nasdaq: AAEPX, Nasdaq: AEMMX, Nasdaq: ACKBX, Nasdaq: ACECX, Nasdaq: AMKIX, Nasdaq: TWMIX, Nasdaq: NDAQ, NYSE: PIZ, NYSE: PIE, NYSE: PDP, NYSE: DIA, NYSE: SPY, NYSE: NYX, NYSE: DOG, NYSE: SDS, NYSE: QLD, NYSE: IWM, NYSE: TWM, NYSE: IWD, NYSE: SDK, NYSE: ICE, Nasdaq: QQQQ, Nasdaq: NDAQ, NYSE: NYX, Nasdaq: HTOAX, Nasdaq: HTOTX, Nasdaq: HTOBX, Nasdaq: JTCIX, Nasdaq: JTCNX, Nasdaq: JTCAX.
Please see our disclosures at the Wall Street Greek website and author bio pages found there. This article and website in no way offers or represents financial or investment advice. Information is provided for entertainment purposes only.

Labels: Technical_Analysis


0 Comments:
Post a Comment
<< Home